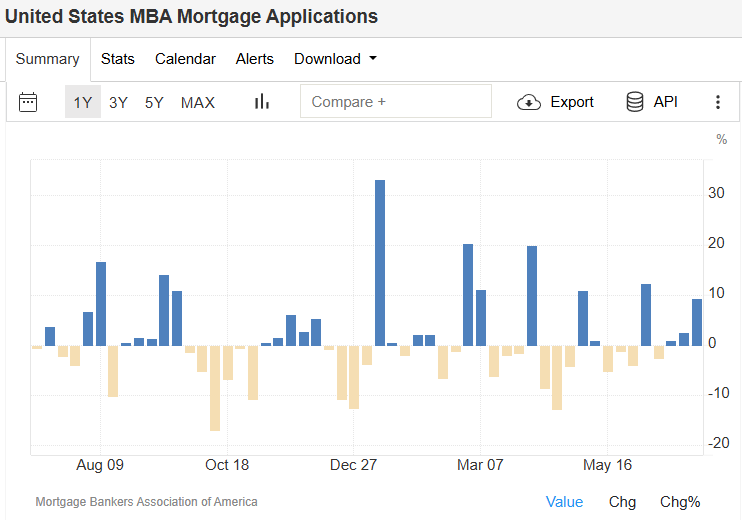
Mortgage Applications See Strongest Weekly Rise in a Month
In the first week of July 2025, the volume of U.S. mortgage applications soared by 9.4% from the previous week — the largest increase in a month, according to data from the Mortgage Bankers Association. This marks the third consecutive weekly gain, the longest streak since December 2024, as benchmark mortgage rates dipped to their lowest since April.
Refinancing activity, which tends to respond quickly to changes in short-term rates, jumped 9% week-over-week and surged 56% compared to the same period in 2024. Similarly, purchase applications rose 9% on the week and were up 25% year-over-year, highlighting renewed strength in the housing market. source: Mortgage Bankers Association of America
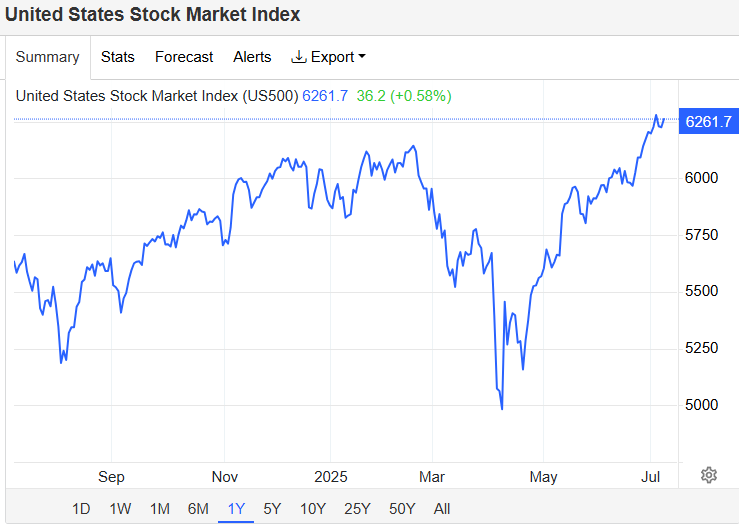
Markets Edge Higher on Trade Announcements and Fed Speculation
U.S. equities closed higher on Wednesday as traders digested updates on trade policy and awaited the Federal Reserve’s next moves. The S&P 500 gained 0.5%, the Nasdaq climbed 0.7%, and the Dow Jones rose by nearly 200 points.
President Trump signaled that major trade announcements would be made, including a planned 50% tariff on copper imports and potential 200% tariffs on pharmaceuticals, though implementation is delayed by 12–18 months to give industries time to adapt.
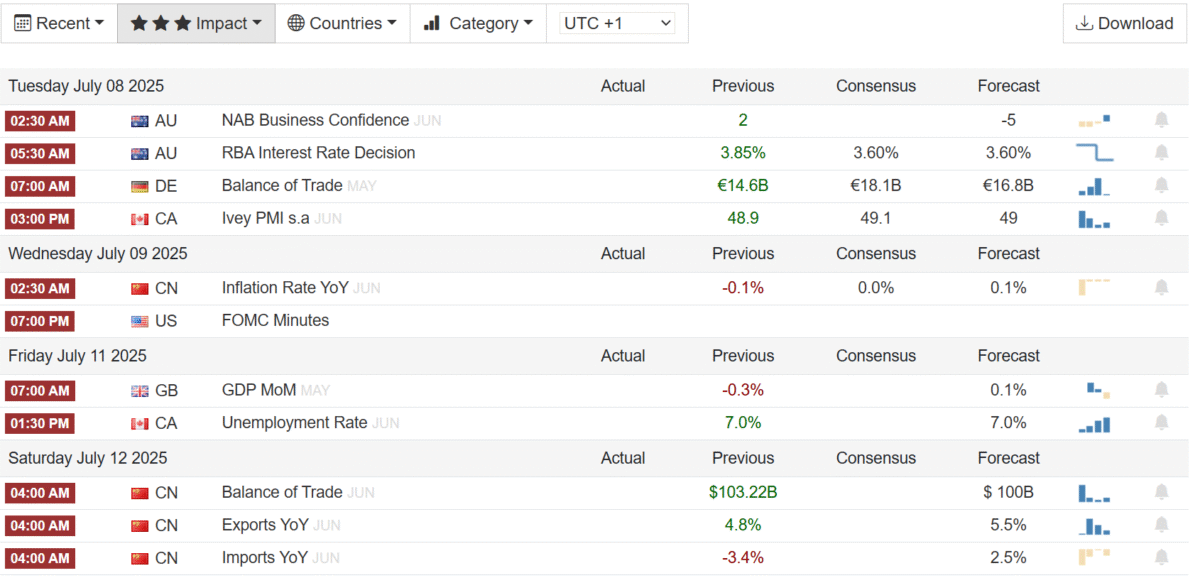
Market participants are closely watching for the FOMC minutes release, which may offer insights into the timing of potential interest rate cuts. Expectations remain strong for two 25 basis point cuts before year-end.
Technology stocks led gains, with Nvidia up 2.2% and Microsoft rising 1.2%. Apple shares were flat, following a statement by White House Trade Counselor Peter Navarro suggesting the company considers itself “too big to tariff.”
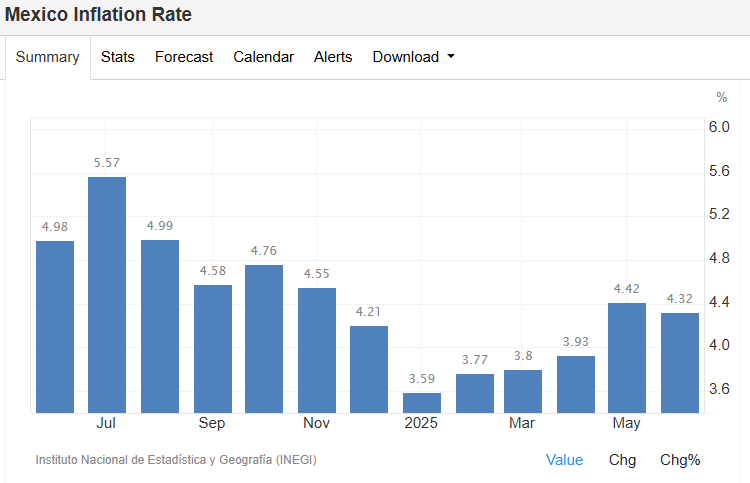
Mexico’s Inflation Slows but Core Pressures Rise
Mexico’s annual inflation rate eased to 4.32% in June 2025, down slightly from 4.42% in May, aligning closely with market expectations of 4.31%, according to the national statistics agency INEGI.
Price growth moderated in agriculture (5.04% vs 6.76%) and energy (3.56% vs 3.93%), while accelerating for goods, food, beverages, and services. Notably, core inflation ticked up to 4.24%, suggesting that underlying price pressures remain sticky.
On a monthly basis, inflation was unchanged at 0.28%, maintaining the same pace as in May. Instituto Nacional de Estadística y Geografía (INEGI)
Conclusion
With falling mortgage rates energizing the U.S. housing market, equity markets buoyed by trade policy hints, and inflation trends in Mexico showing mixed signals, July 2025 is shaping up to be a pivotal month for both investors and policymakers.
Stay tuned for more updates on monetary policy, inflation data, and global economic trends.