📉 DE40 Slips as Inflation Cools and Retail Sales Drop: Germany Stock Market Outlook

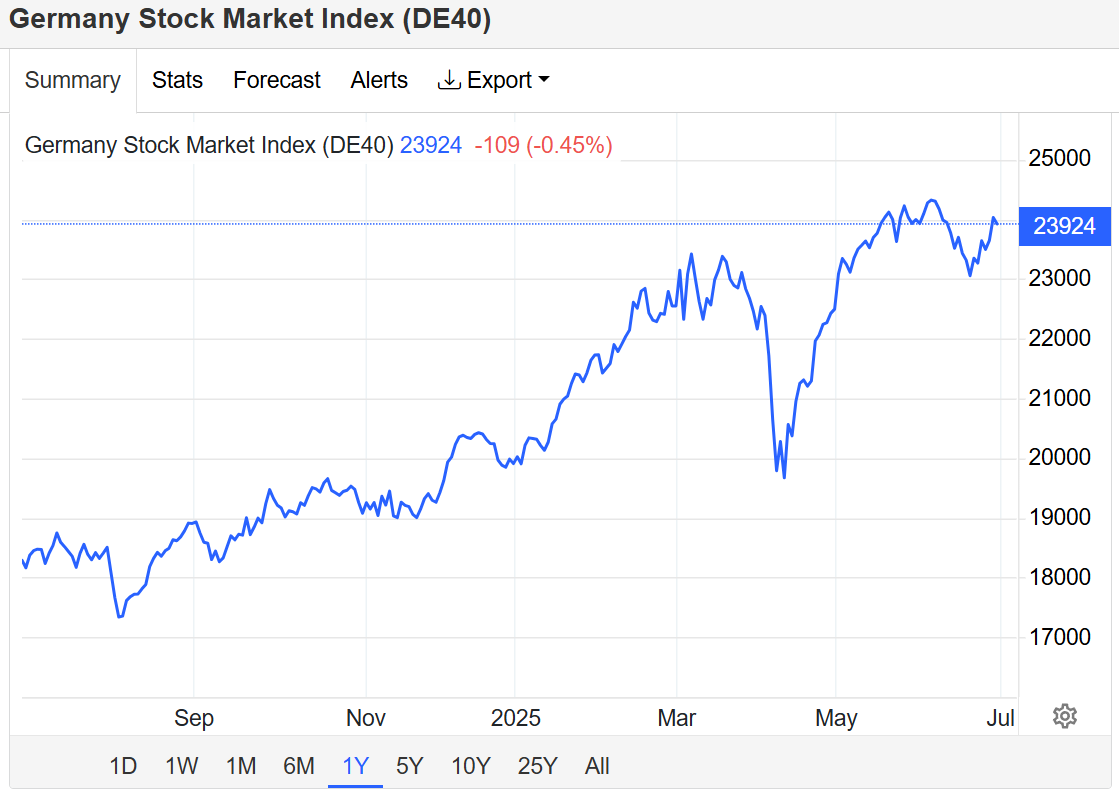
📊 Germany Stock Market Index (DE40) Falls Amid Economic Uncertainty

The Germany Stock Market Index (DE40)—which tracks the performance of 40 top German blue-chip stocks—closed down 0.5% at 23,910 on Monday, breaking a two-day winning streak. The decline comes amid mixed domestic economic data and renewed trade concerns.


đŸ‡©đŸ‡Ș Key Economic Indicators in Germany

✅ Inflation Cools in June

German inflation surprised markets by dropping to 2.0% year-on-year in June, down from 2.1% in May and below the 2.2% forecast. This signals easing price pressure, potentially giving the European Central Bank (ECB) more flexibility on interest rates.

❌ Retail Sales Point to Weak Consumer Demand

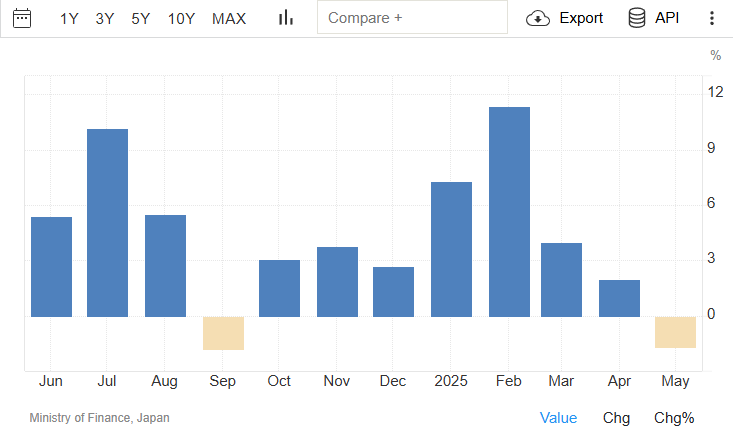
Germany’s retail sales fell 1.6% in May, following a 0.6% drop in April. This back-to-back decline underlines sluggish domestic consumption, a key factor limiting broader economic recovery in Europe’s largest economy.


🌐 Trade Tensions Add Market Pressure

Global trade uncertainty continues to weigh on the German stock market. U.S. President Trump confirmed that trade negotiations are ongoing but won’t extend the current 90-day tariff pause beyond July 9. This raises risks for Germany’s export-heavy economy, especially sectors like automotive and chemicals.


đŸ”» Biggest DAX Losers: Symrise and Bayer

  • Symrise AG led the market declines with a sharp 7% drop, likely due to sector sentiment or earnings-related concerns.
  • Bayer AG tumbled 5.4% after the U.S. Supreme Court requested the government’s opinion on Monsanto weedkiller litigation, reigniting legal uncertainty for the pharma and agrochemical giant.

📆 DE40 Monthly Performance

Despite occasional gains, the DAX (DE40) ended June with a modest 0.4% loss, reflecting ongoing macroeconomic headwinds and market caution.


📌 What to Watch Next

  • July 9 Trade Deadline: Markets will closely monitor whether new tariffs are imposed.
  • Upcoming ECB Decisions: Slower inflation may influence monetary policy.
  • Consumer Confidence & Earnings Reports: Key indicators for Q3 market direction.
Line chart of DE40 index performance (June 2024 2025)
EU Stock Indexes

    First Name (required)

    Last Name (required)

    Your Email (required)

    Preferred Method of Contact (required)
    eMailPhoneSkypeWhatsApp/Viber/Telegram,etc.

    Your Phone (required)

    Your Mobile

    Your Skype

    Category (required)

    Subject (required)

    Your Message (required)

    I am interested in (tick all that apply):

    GDPR Agreement*
    See our privacy policy to learn more about how we use data.

    Use this image to open your trading account with MultiBank MEXAtlantic

    U.S. Housing Market Slumps in May 2025 | Fed Dovish, Tech Stocks Rally

    🏠 U.S. New Home Sales Plunge in May 2025 as Buyers Retreat Amid High Mortgage Rates

    New single-family home sales in the U.S. fell sharply in May 2025, dropping 13.7% month-over-month to a seasonally adjusted annualized rate of 623,000 units, according to the U.S. Census Bureau. This marks the biggest decline since June 2022, far below market expectations of around 700,000 units.

    📉 Housing Market Breakdown:

    • South: -21% to 349,000 units
    • West: -5.4% to 159,000 units
    • Midwest: -7.1% to 78,000 units
    • Median home price: $507,000 (+1.4%)
    • Supply: 9.8 months at current sales pace

    High mortgage rates and economic uncertainty are causing many potential buyers to delay purchases, signaling a cooling housing market despite rising prices.


    📊 Stock Market Update: Tech Leads, Real Estate Lags

    The S&P 500 rose 0.2% on Wednesday, while the Nasdaq 100 gained 0.4%, inching closer to a new all-time high. The Dow Jones remained near flatline levels.

    Top Performers:

    • Nvidia: +1.3%
    • Apple: +1.2%
    • Microsoft: +0.6%
    • Amazon: +1.1%
    • Meta: +0.2%

    Underperformers:

    • Real Estate sector (reflecting weak housing data)
    • FedEx: -5% after disappointing profit forecast

    Investor sentiment was buoyed by Fed Chair Jerome Powell’s dovish testimony before Congress, which reinforced expectations of at least two interest rate cuts by the end of 2025. In addition, a ceasefire between Iran and Israel helped calm global markets.


    đŸ’” Dollar Index Holds as Fed Signals Policy Flexibility

    The U.S. Dollar Index (DXY) held steady at 98 on Wednesday, pausing its recent slide to multi-year lows.

    Key Drivers:

    • Powell’s remarks: Economic uncertainty justifies patience on interest rates
    • Disinflation outlook: Maintained as long as no new tariffs are introduced (watch for July 9 deadline)
    • Energy prices: Falling due to stability in the Strait of Hormuz, boosting bets on slowing inflation

    Meanwhile, other major economies are also leaning toward monetary easing, helping to stabilize the greenback despite rate cut expectations in the U.S.


    📌 Final Thoughts: What to Watch Next

    • Will housing weakness extend into summer?
    • Can tech continue to lead the market higher?
    • July 9 tariff decision will be critical for inflation and Fed policy
    • Watch for inflation and jobs data to confirm (or challenge) rate cut bets

    📬 Stay tuned for more market insights and economic updates.
    📱 Don’t forget to share this post and leave a comment below with your thoughts on where the market is headed next!

      First Name (required)

      Last Name (required)

      Preferred Method of Contact (required)

      eMailPhoneSkypeWhatsApp/Viber/Telegram,etc.


      Your Email (required)

      Your Phone (required)

      Your Mobile

      Your Skype

      Your Message (required)

      I am interested in (tick all that apply):

      GDPR Agreement*
      See our privacy policy to learn more about how we use data.

      European Markets Rally as Israel-Iran Ceasefire Holds & Fed Hints at Rate Cuts

      European Stocks Climb as Ceasefire Holds, Fed Dovish Tone Lifts Sentiment

      Markets held onto their upward momentum Wednesday, with the STOXX 50 and STOXX 600 indices both rising 0.3%, extending gains of over 1% from the previous session. Investors were buoyed by easing geopolitical tensions and growing hopes for a Federal Reserve rate cut later this year.

      🌍 Geopolitical Calm Brings Relief

      The recent ceasefire between Israel and Iran appears to be holding, providing a much-needed breather for global markets. The truce—brokered by the United States—has helped temper fears of a broader conflict in the Middle East, a key concern for global investors in recent weeks.

      📉 Fed Signals Potential Rate Cuts

      Further optimism was driven by Federal Reserve Chair Jerome Powell, who gave testimony before the U.S. Congress on Tuesday. His remarks were widely interpreted as dovish, increasing expectations that the Fed could cut interest rates later this year, providing additional support to financial markets.

      🔍 Focus Shifts to NATO Summit

      Investors are now watching the NATO summit in the Netherlands, where discussions around defense spending and geopolitical stability are taking center stage. Any shifts in policy or alliances could have broader market implications.


      Winners on the European Stock Front

      Several major companies posted strong gains amid the upbeat mood:

      • Ferrari (RACE): +3.6%
      • Stellantis (STLA): +3.7%
      • ASML Holding (ASML): +2.3%
      • Philips (PHG): +2.0%
      • Rheinmetall (RHM): +1.5%

      These moves reflect renewed investor confidence across a range of sectors, from luxury autos to defense and technology.


      Crude Oil Bounces Back After Heavy Selloff

      WTI crude oil prices rebounded above $65 per barrel on Wednesday, recovering some ground after a 13% plunge over the prior two sessions—the steepest two-day fall since 2022.

      đŸ”„ What’s Driving Oil?

      • The ceasefire in the Middle East is reducing supply disruption fears.
      • President Trump signaled support for China—Iran’s top buyer—to continue importing Iranian oil, potentially reshaping the U.S. sanctions landscape.
      • Despite this, a preliminary U.S. intelligence report warned that American strikes on Iranian nuclear facilities only delayed the program by a few months, keeping geopolitical risk on the table.

      📉 Supply Tightens

      Fresh industry data revealed a 4.28 million barrel drop in U.S. crude inventories last week, smashing forecasts for just a 0.6 million barrel draw. This marks the fourth consecutive weekly decline and signals tightening supply conditions.


      🧠 Final Thoughts

      Markets are finding their footing amid complex global dynamics. While the ceasefire and dovish Fed tone provide near-term relief, investors remain cautious as geopolitical risks and inflation pressures continue to shape the global economic outlook.

      Register With Swap Hunter to Get your FREE Consultation

        First Name (required)

        Last Name (required)

        Preferred Method of Contact (required)

        eMailPhoneSkypeWhatsApp/Viber/Telegram,etc.


        Your Email (required)

        Your Phone (required)

        Your Mobile

        Your Skype

        Your Message (required)

        I am interested in (tick all that apply):

        GDPR Agreement*
        See our privacy policy to learn more about how we use data.

        Get Your MultiBank, MEX Atlantic Trading Account today

        📈 Market Update: Yen Recovers on BOJ Inflation Signals, Bitcoin Dips Below $100K


        đŸ‡ŻđŸ‡” Japanese Yen Strengthens as BOJ Eyes Inflation Risks

        The Japanese yen gained strength on Friday, trading near „145 per U.S. dollar, as Japan’s core inflation surged for the third consecutive month. The latest reading came in at 3.7%, marking the highest level since January 2023 and reinforcing expectations that the Bank of Japan (BOJ) could tighten monetary policy further.

        Key Highlights:

        • BOJ keeps interest rate at 0.5% but signals openness to further hikes.
        • Governor Kazuo Ueda emphasized a data-driven approach.
        • Companies continue passing wage increases onto prices, keeping inflation sticky.
        • Despite Friday’s rebound, the yen is still down ~1% for the week due to safe-haven flows into the U.S. dollar, amid rising geopolitical tensions between Israel and Iran.

        📊 Takeaway: A stronger yen may be on the horizon if inflation remains persistent and the BOJ follows through with rate hikes. However, global risk sentiment and U.S. dollar strength are key counterweights.


        ₿ Bitcoin Slips Below $100K Amid Broader Market Uncertainty

        On Sunday, June 22, Bitcoin (BTC/USD) fell to $99,449, marking a 2.15% decline from the previous session. Over the past month, Bitcoin has lost 7.32%, reflecting broader risk-off sentiment across markets.

        Bitcoin Performance Overview:

        • Daily: -2.15%
        • 4-week: -7.32%
        • 12-month: +57.06%

        Price Forecasts (via Trading Economics):

        • End of Q2 2025: $102,869
        • 12-Month Outlook: $100,787

        💡 Outlook: Despite short-term dips, long-term fundamentals and macro trends suggest Bitcoin may stabilize or climb moderately in the coming months. However, global tensions and central bank policies could add continued volatility.


        🌍 Final Thoughts

        Both traditional currencies like the yen and digital assets like Bitcoin are being shaped by a complex macroeconomic environment, featuring persistent inflation, central bank shifts, and geopolitical unrest.

        What to Watch:

        • Next BOJ policy meeting and inflation reports.
        • U.S. Federal Reserve commentary on rates and inflation.
        • Developments in the Middle East and their impact on safe-haven assets.

        📰 Stay Informed: Subscribe for weekly macro updates and in-depth analysis on currencies, crypto, and global markets.

          First Name (required)

          Last Name (required)

          Preferred Method of Contact (required)

          eMailPhoneSkypeWhatsApp/Viber/Telegram,etc.


          Your Email (required)

          Your Phone (required)

          Your Mobile

          Your Skype

          Your Message (required)

          I am interested in (tick all that apply):

          GDPR Agreement*
          See our privacy policy to learn more about how we use data.

          Click Here to Open a Trading Account with MultiBank Group.

          đŸ’„ Michael Burry’s 13F Filing & Portfolio Strategy for a Recessionary Storm (2025 Outlook)

          In a year already fraught with volatility and economic uncertainty, it’s always reassuring to see our thesis confirmed by none other than the legendary Michael Burry. In his latest 13F filing, Burry’s portfolio adjustments echo what many of us have been preparing for: a recessionary reset, an asset repricing, and a rare opportunity to make serious money if you’re positioned right.

          In this post, we break down:

          • Key takeaways from Burry’s 13F
          • What Buffett and BlackRock’s Larry Fink are signaling
          • Actionable strategies to optimize your portfolio
          • How to hedge risk, earn swaps, and profit from market chaos

          📌 Key Takeaways from Michael Burry’s 13F Filing (Q1 2025)

          Burry has trimmed exposure and taken a sharply defensive stance. Here’s what stands out:

          • ✅ Fewer total holdings – indicating caution
          • đŸ›Ąïž Defensive sectors (healthcare, utilities) are up
          • ⚠ Put options and hedges still in play – suggesting he expects more pain ahead

          He’s not alone. Warren Buffett has raised cash, and Larry Fink is leaning heavily on bonds and ESG resilience. Big money is playing defense.


          📉 Recession Indicators You Can’t Ignore

          1. Inverted Yield Curve

          This recession classic has been flashing red for over 12 months — historically a clear precursor to contraction.

          2. LEI Index (Leading Economic Index)

          Steep and consistent declines in this index are signaling weakening business confidence and slowing economic activity.

          3. Consumer Debt Crisis

          With rising credit card balances and growing delinquency rates, consumers are stretched thin — a recipe for demand destruction and asset repricing.


          💄 Lipstick Effect & Changing Consumer Behavior

          When people cut back, they still splurge on small luxuries — a phenomenon known as the lipstick effect. But this signals trouble:

          • Mid-tier retail is hurting
          • Premium brands see temporary support
          • Discretionary spending is collapsing under debt pressure

          đŸ§Ÿâ€â™‚ïž Time to Cut the Zombies

          Higher rates are suffocating “zombie companies” — those dependent on cheap debt to survive. Their fall will be sharp and painful
 but it’s also a generational buying opportunity in real assets and healthy balance sheets.


          📊 Sample Recession-Ready Portfolio Allocation

          Here’s how to position your portfolio over the next 3–9 months:

          Asset ClassWeightPurpose
          đŸ’” Cash / Short-Term Bonds20%Dry powder & safety
          đŸ›Ąïž Defensive Equities15%Recession resilience (e.g. JNJ, KO, XLU)
          💎 High-Quality Value Stocks10%Buffett-style buys
          đŸ„‡ Commodities15%Hedge inflation, supply shocks
          📉 Inverse ETFs & Puts10%Bear market hedge
          🌍 Swap Hunter FX Positions10%Earn yield & hedge currency risks
          📈 EM Equities (Targeted)5%High risk/reward bets
          ⚠ Speculative / Event-driven5%Distressed tech, TLT, etc.
          đŸȘ™ Gold Miners / Crypto Hedge5%Crisis alpha

          🧠 Pro tip: Don’t hold inverse ETFs forever. Rotate and hedge tactically.


          🔄 Recession Scenario Stress Test

          ScenarioEquitiesCommoditiesPortfolio Impact
          Mild Recession-10%+5–10%+2–5% overall
          Hard Landing-25%-10%Flat to slightly down
          Inflation Spike Returns+5%+15%+7–10% gain

          đŸ§© Bonus: Options Hedge Strategy

          Build a recession collar:

          • ✅ Long Puts on SPY/QQQ
          • ✅ Short Calls on KO/JNJ (income)
          • ✅ Long VIX Calls (spike protection)

          ✅ Conclusion: Don’t Just Survive—Position to Thrive

          We’re entering a once-in-a-decade macro reset. Whether you’re following Burry’s lead, watching Buffet’s trims, or managing Swap Hunter FX trades — this is not the time to sit still. Position yourself defensively, keep dry powder ready, and don’t fear the correction — embrace it.


          🚀 Ready to Take Action?

          Want help building this portfolio, rebalancing your FX swaps, or optimizing your hedges? Let’s talk. Drop a comment, or reach out directly for custom strategy guidance.


          🔔 Subscribe for More:

          Get weekly macro outlooks, portfolio models, and trading strategies right in your inbox. Sign up now and stay ahead of the herd.

            First Name (required)

            Last Name (required)

            Preferred Method of Contact (required)

            eMailPhoneSkypeWhatsApp/Viber/Telegram,etc.


            Your Email (required)

            Your Phone (required)

            Your Mobile

            Your Skype

            Your Message (required)

            I am interested in (tick all that apply):

            GDPR Agreement*
            See our privacy policy to learn more about how we use data.

            Click to Register your Trading Account with MultiBank Exchange

            📉 Global Economic Update – June 20, 2025

            Stay informed with today’s key macroeconomic and market highlights from the U.S., Japan, Germany, and global equity markets.


            đŸ‡ș🇾 U.S. Manufacturing Remains in Contraction

            The Philadelphia Fed Manufacturing Index held steady at -4.0 in June 2025, unchanged from May and below market expectations of -1. This marks another month of subdued regional manufacturing activity.

            Key Highlights:

            • New orders stayed positive but weakened.
            • Shipments improved and turned positive.
            • Employment fell sharply, reaching its lowest level since May 2020, signaling a drop in factory jobs.
            • Price pressures eased slightly but remain historically high.
            • Outlook: Business optimism is waning, with fewer firms expecting growth in the next six months.

            👉 Takeaway: Continued weakness in manufacturing could influence the Fed’s policy stance going forward.


            đŸ‡ŻđŸ‡” Japan Inflation Eases, Core CPI Surges

            Japan’s annual inflation rate fell slightly to 3.5% in May 2025, down from 3.6% in the previous two months. However, core inflation (excluding fresh food and energy) rose to 3.7%, the highest in over two years.

            Breakdown:

            • Declines in prices for clothing, healthcare, and household goods.
            • Housing, recreation, and communications saw rising costs.
            • Rice prices skyrocketed over 100% year-over-year, showing limited impact from government price controls.

            👉 Takeaway: Inflation remains a concern ahead of Japan’s summer elections, adding complexity to BoJ policy decisions.


            đŸ‡©đŸ‡Ș German Producer Prices Drop Sharply

            Germany’s Producer Price Index (PPI) fell 1.2% year-over-year in May 2025, marking the third straight month of decline and the sharpest drop since September 2024.

            Details:

            • Energy prices fell sharply:
              • Electricity: -8.1%
              • Natural gas: -7.1%
              • Heating oil: -10.2%
            • Excluding energy, producer prices rose 1.3% YoY.
            • Monthly PPI dropped 0.2%, better than the expected 0.3% decline.

            👉 Takeaway: Cooling input prices support the ECB’s disinflation narrative but won’t remove all pressure from sticky core inflation.


            📊 U.S. Markets Set for a Lower Open

            After Wednesday’s Juneteenth holiday, U.S. stock futures point to a slightly lower open as investors react to:

            • Ongoing geopolitical tensions in the Middle East.
            • President Trump’s delayed decision on Iran, while strikes from Israel continue.
            • Oil prices retreat, weighing on energy stocks.
            • CarMax expected to open 10%+ higher after strong earnings.
            • Triple Witching Day could increase market volatility.

            👉 Takeaway: Risk appetite remains fragile. Expect choppy trading as geopolitical uncertainty and technical factors weigh on sentiment.


            📌 Final Thoughts

            Economic data continues to paint a mixed global picture—slowing growth, sticky inflation, and rising geopolitical risks. Investors should brace for near-term volatility and monitor central bank signals closely.

              First Name (required)

              Last Name (required)

              Preferred Method of Contact (required)

              eMailPhoneSkypeWhatsApp/Viber/Telegram,etc.


              Your Email (required)

              Your Phone (required)

              Your Mobile

              Your Skype

              Your Message (required)

              I am interested in (tick all that apply):

              GDPR Agreement*
              See our privacy policy to learn more about how we use data.

              Established in 2005 a Trusted Broker with 20 years in the Industry

              Trade over 20,000 instruments including Forex, Metals, Shares, Indices, Commodities & Cryptocurrencies.

              Security of funds $1,000,000 Excess Loss Insurance policy with Lloyd’s of London

              regulated by ASIC, AUSTRAC, BAFIN, CIMA, ESCA, CySEC, FSC, FMA, MAS, TFG and VFSC.

              25+ Offices Located within the Financial Centres of the World

              Withdrawals completed within 24 hours

              Tier 1 Level Banking

              Segregated Client Accounts

              B Rating by Standard & Poor’s

              Take your first step towards Financial Freedom with a Swap Hunter Trading Account

              🌍 Market Update: European Stocks Dip Amid Geopolitical Risks, Fed Decision in Focus

              European Markets Open Lower

              European equity markets were set to open lower on Wednesday as investors digested rising geopolitical tensions and awaited the U.S. Federal Reserve’s interest rate decision.

              • Euro Stoxx 50 futures slipped 0.3%
              • Stoxx 600 futures edged down 0.2%

              Sentiment was hit by comments from U.S. President Donald Trump, who demanded Iran’s “unconditional surrender” and threatened to strike Supreme Leader Khamenei, further escalating tensions in the Middle East.

              Investors are also eyeing:

              • UK inflation data
              • Sweden’s Riksbank policy decision

              Both could influence European interest rate expectations.


              📉 Japan’s Exports Decline Amid Tariff Pressures

              Japan’s exports fell 1.7% year-on-year in May 2025 to a four-month low of JPY 8.13 trillion, reversing a 2% gain in April. This marked the first decline since September 2024.

              • Shipments to the U.S.: ↓ 11.1%
              • Exports to China: ↓ 8.8%
              • Increases: EU (+4.9%), Russia (+5.2%), ASEAN (+0.1%)

              Trade War Impact

              The decline came as U.S. tariffs bite, especially on autos, auto parts, and chip machinery. Japan is seeking exemption from 25% U.S. auto tariffs, while Trump has doubled duties on steel and aluminum to 50%. A 24% retaliatory tariff from Japan is scheduled for July 9, unless a deal is reached.


              đŸȘ™ Gold Slips as Dollar Gains, But Central Banks Remain Bullish

              Gold prices edged lower to around $3,380/oz on Wednesday. A stronger U.S. dollar weighed on prices, even as Middle East tensions drove safe-haven demand.

              Key Drivers:

              • Israel conducted strikes near Tehran
              • Iran launched missiles in retaliation
              • Trump held a national security meeting, sparking fears of U.S. military involvement

              Meanwhile, a World Gold Council survey revealed:

              • 95% of central banks expect global gold reserves to rise
              • 43% plan to increase their own holdings — a record high

              đŸ’” U.S. Dollar Eases After Tuesday Surge

              The U.S. Dollar Index (DXY) dipped slightly to 98.6 after a near 1% gain on Tuesday, driven by safe-haven flows due to the Israel-Iran conflict.

              What to Watch:

              • Federal Reserve is expected to hold rates steady
              • Market focus is on forward guidance
              • Upcoming U.S. data: housing starts and jobless claims

              Despite weaker retail sales in May, consumer spending remains resilient, underpinned by strong wage growth.


              📌 Takeaway

              Global markets remain on edge as geopolitical risks, trade tensions, and monetary policy uncertainty collide. Investors are bracing for potential volatility spikes driven by:

              • Fed’s policy stance
              • Ongoing Middle East conflict
              • Looming U.S.-Japan tariff deadlines

              Stay tuned for more updates and subscribe for a consultation from Swap Hunter and real-time market insights.

                First Name (required)

                Last Name (required)

                Preferred Method of Contact (required)

                eMailPhoneSkypeWhatsApp/Viber/Telegram,etc.


                Your Email (required)

                Your Phone (required)

                Your Mobile

                Your Skype

                Your Message (required)

                I am interested in (tick all that apply):

                GDPR Agreement*
                See our privacy policy to learn more about how we use data.

                How Much of Your Portfolio Should Be in Cash or Forex?

                When building or managing a portfolio, one of the most overlooked but crucial components is your cash and FX (foreign exchange) allocation. While many investors focus on stocks, crypto, or real estate, holding the right amount of liquid assets can significantly enhance your financial stability, flexibility, and overall strategy.


                Why Cash and FX Matter

                Cash provides liquidity. It allows you to take advantage of opportunities quickly, cover unexpected expenses, and weather downturns without panic selling. FX (foreign currencies like USD, EUR, or JPY) can serve as a hedge, especially if you’re exposed to international assets or geopolitical risk.


                General Guidelines Based on Investor Type

                1. Long-Term Investors (Passive Strategy)

                If you’re primarily focused on long-term growth with a buy-and-hold strategy, a smaller cash allocation is typical.

                Portfolio SizeSuggested Cash/FX Allocation
                <$100,0005% – 10%
                $100,000+2% – 5%

                Purpose: Emergency liquidity, buying dips, or portfolio rebalancing.


                2. Active Traders and Speculators

                If you trade crypto, stocks, or CFDs, you need more liquidity to remain agile.

                Strategy TypeSuggested Cash/FX Allocation
                High-frequency trading5% – 20%
                Swing trader10% – 30%
                CFD/multi-asset trading20% – 40%

                Why more cash? To manage margin, fund trades quickly, and handle drawdowns.


                3. Conservative/Wealth Preservation Investors

                Age and risk appetite affect how much cash you should hold.

                Age GroupSuggested Cash Allocation
                Under 405% – 10%
                40–6010% – 20%
                60+20% – 40%

                Purpose: Reduce volatility, maintain access to funds, and protect principal.


                When to Increase Your Cash/FX Position

                • Anticipating a market downturn or recession
                • Planning for a large purchase or investment
                • Experiencing high portfolio volatility
                • Preparing to rebalance or rotate assets

                Rule of Thumb

                “Keep enough in cash and FX to sleep well at night, but not so much that inflation eats it away.”


                Final Thoughts

                Your ideal cash or FX allocation depends on your goals, timeline, and risk tolerance. Revisit it regularly, especially in changing market conditions. Liquidity is power—but too much can be a drag on growth.

                Need help figuring out your ideal allocation? Organise a free consultation with Swap Hunter to ensure your portfolio is optimized for both opportunity and protection.

                  First Name (required)

                  Last Name (required)

                  Preferred Method of Contact (required)

                  eMailPhoneSkypeWhatsApp/Viber/Telegram,etc.


                  Your Email (required)

                  Your Phone (required)

                  Your Mobile

                  Your Skype

                  Your Message (required)

                  I am interested in (tick all that apply):

                  GDPR Agreement*
                  See our privacy policy to learn more about how we use data.

                  📊 Market Calm Before the Storm: Why Swap-Hunter Thrives in Uncertainty

                  As markets await U.S.–China trade talks and critical inflation data, Swap-Hunter’s trading system gives you the tactical edge to profit—no matter the volatility.


                  Global stock markets opened cautiously this week, with U.S. futures hovering near flat. For many traders, this signals indecision. But at Swap-Hunter, this is where our trading system shines.

                  Whether it’s geopolitical risk, inflation uncertainty, or headline-driven swings, our system thrives on structure—not speculation.

                  🌍 What’s Moving the Market This Week?

                  • U.S.–China Trade Talks (June 9) – High-level negotiations resume in London.
                  • CPI and PPI Inflation Data – Key indicators ahead of the Fed’s June meeting.
                  • Fed Rate Decision (June 17–18) – Rate cut speculation building.
                  • Geopolitical Risk – Domestic protests and National Guard deployment add market tension.

                  🔄 What This Means for Traders

                  While traditional systems wait for breakouts or trend confirmations, Swap-Hunter works within the noise. Our system capitalizes on:

                  • Flat Markets – Ideal for range-bound swaps and intraday structure plays.
                  • Volatility Surges – Our setup detects liquidity zones that react to news-based momentum.
                  • Institutional Footprints – Identify where real volume is being deployed—not just where price moves.

                  📈 S&P 500 Snapshot

                  The S&P recently reclaimed the 6,000 level and is now just 2.3% off all-time highs. Rather than chase tops, our system monitors rotational liquidity and traps.

                  S&P500 Rotation Zones

                  Example chart: Rotation zones identified by the Swap-Hunter system

                  ⚙ Why Swap-Hunter Is Built for This

                  Markets are not always trending. In fact, they spend most of their time consolidating. This is where Swap-Hunter’s rules-based, volatility-adaptive system gives you:

                  • High-probability setups in quiet markets
                  • Dynamic risk management around key macro events
                  • Real-time structural edge vs. reactive trading

                  ✅ Your Next Move

                  Don’t sit on the sidelines while others guess the outcome of this week’s data and talks. Trade with structure. Trade with precision.

                  🔗 Join Swap-Hunter today and start trading the markets with confidence—whatever headlines come next.


                  Tags: U.S.–China Trade, CPI, PPI, Fed Meeting, Trading System, Swap-Hunter, S&P 500, Market Structure

                  US Job Data Cools Less Than Expected in May – What It Means for Markets and Workers


                  How to Trade Forex and Jobs Data with Swap Hunter

                  In a surprising turn, the latest US job data suggest that the labour market is more resilient than analysts had projected. According to the recent payroll data, US nonfarm employment increased by 139,000 jobs in May, slightly lower than April’s revised figure of 147,000 but higher than the consensus estimate of 130,000.

                  This unexpected uptick challenges earlier concerns of a sharper slowdown, amid fears of new tariffs and broader economic headwinds. While the pace of job creation has softened, the labour market continues to send mixed signals that demand a closer look.

                  Key Highlights:

                  • May Job Growth: +139K (vs. 130K expected)
                  • April Revisions: Downwardly adjusted to +147K
                  • Unemployment Rate: Steady at 4.2%

                  Sector-Specific Trends

                  Employment growth wasn’t evenly distributed. Some industries fared better than others:

                  • Healthcare, leisure and hospitality, and social assistance showed steady gains, signaling continued demand for services and care-related roles.
                  • Manufacturing and federal government jobs experienced a decline—potential early signs of budget tightening or shifting production dynamics due to supply chain constraints and tariff concerns.

                  This pattern reinforces the notion that while the US job engine is still running, it’s shifting gears.

                  What This Means for Workers

                  For job seekers, the positive news is that the unemployment rate remains stable, and key service sectors continue to hire. However, those in more cyclical or government-tied industries may want to stay alert to shifting priorities and potential policy changes.

                  Implications for Markets and Policy

                  Wall Street had braced for a sharper pullback in hiring, so this report could bring temporary relief. Still, policymakers at the Federal Reserve will likely keep a close eye on wage trends and broader economic indicators before making any interest rate adjustments.

                  If the economy continues to tread this fine line—neither overheating nor collapsing—it may lend weight to the case for a “soft landing” scenario, which economists have debated for months.

                  Final Thoughts US Jobs Data

                  May’s job data serves as a reminder that economic momentum doesn’t vanish overnight—it tapers, recalibrates, and shifts. For businesses and workers alike, staying flexible and responsive to these trends will be crucial in the coming months.


                  Stay tuned to Swap Hunter for regular updates on the economy, job market trends, and how these shifts impact your career, investments, and day-to-day decisions.

                  Have thoughts on how these trends could affect your industry? Drop your insights in the comments or connect with us on social media.