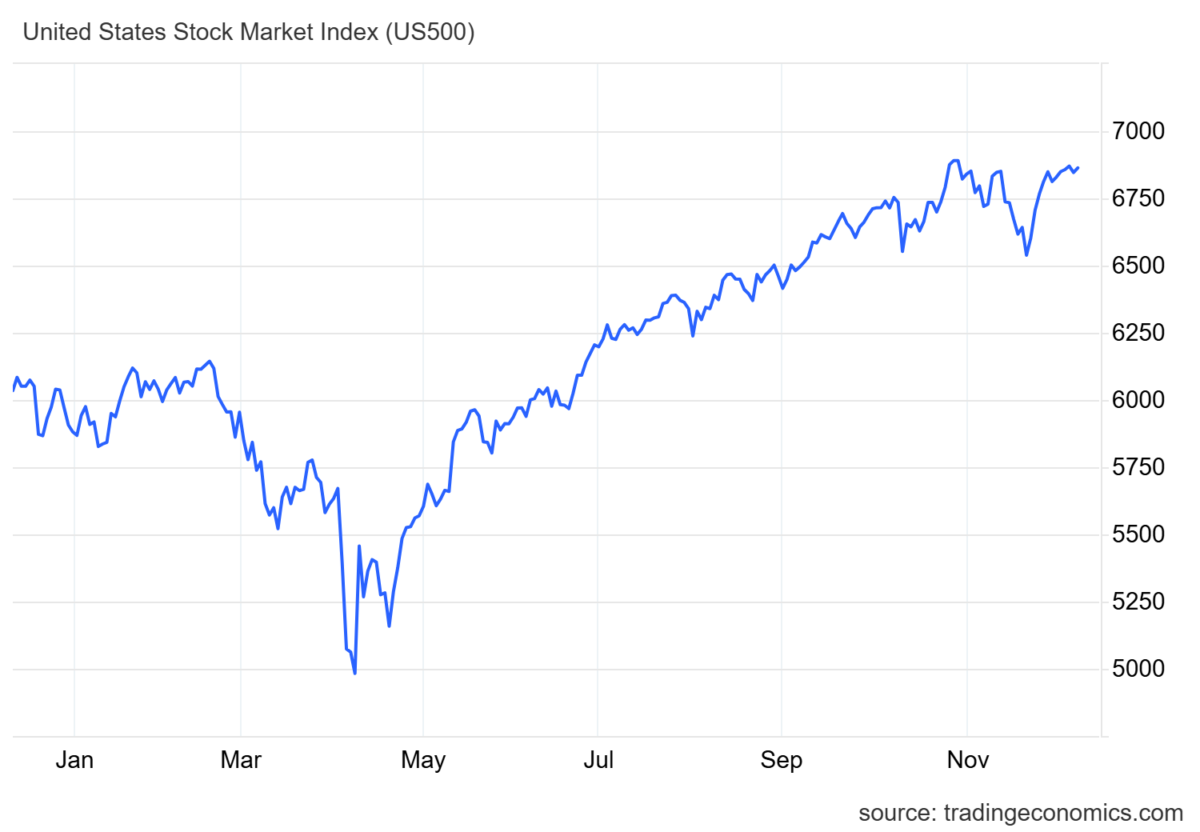
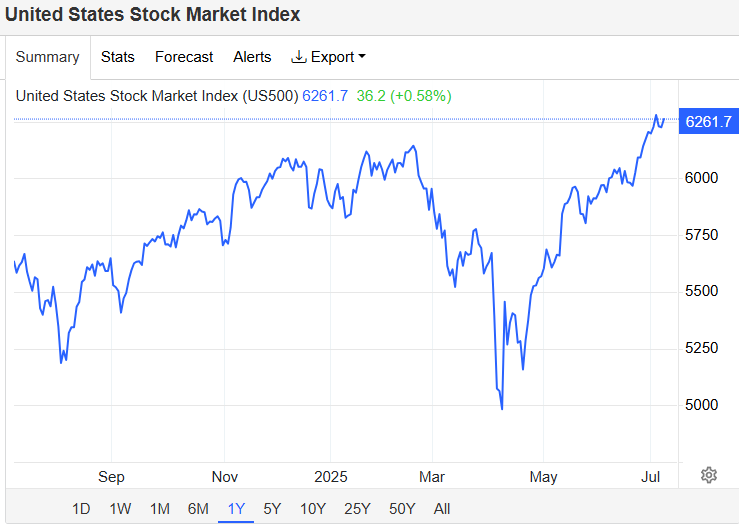
The stock market 2025 review reveals a year of remarkable resilience amid AI-driven growth, tariff uncertainties, geopolitical tensions, and Federal Reserve policy shifts. Major U.S. indices delivered strong double-digit gains, with the S&P 500 rising approximately 16-17%, marking its third consecutive year of robust performance. Precious metals dominated headlines, as gold climbed over 65% and silver soared more than 144%. Bitcoin ended the year near $88,000, down slightly after earlier peaks above $126,000.Despite a late-year pullback in thin holiday trading, the stock market 2025 review shows overall strength, closing near record highs with cautious optimism for 2026.
S&P 500 Daily Performance Chart for 2025
Bullish Signals:
Long-term uptrend intact in major indices.
Potential “January Effect” rally in undervalued small-caps and beaten-down sectors.
Support from expected Fed rate stability or cuts if labor market softens.
Bearish Signals:
Short-term momentum weakening with four-session losing streak ending the year.
Risk of correction if inflation reaccelerates or tariffs escalate.
RSI indicators showing potential exhaustion in tech-heavy names.
Recommendation: Maintain diversified exposure with a tilt toward quality large-caps. Monitor for breakout above recent highs (bullish confirmation) or breakdown below December lows (bearish).Disclaimer: This analysis is for informational purposes only and not investment advice. Markets are volatile; consult a financial advisor.
US equities were mostly flat as traders awaited the Federal Reserve’s interest-rate decision.
S&P 500: +0.1%
Dow Jones: +90 points
Nasdaq: Near unchanged
Expectations: Markets are widely pricing in a 25 bp rate cut on Wednesday. Focus is shifting to the Fed’s updated economic projections, especially regarding the pace of policy easing in 2026.
Labor Market
JOLTS (Sept & Oct): Job openings came in above expectations, signaling still-firm demand for labor.
ADP employment (weekly average through Nov 22):
Private employers added ~4,750 jobs per week, ending three straight periods of declines.
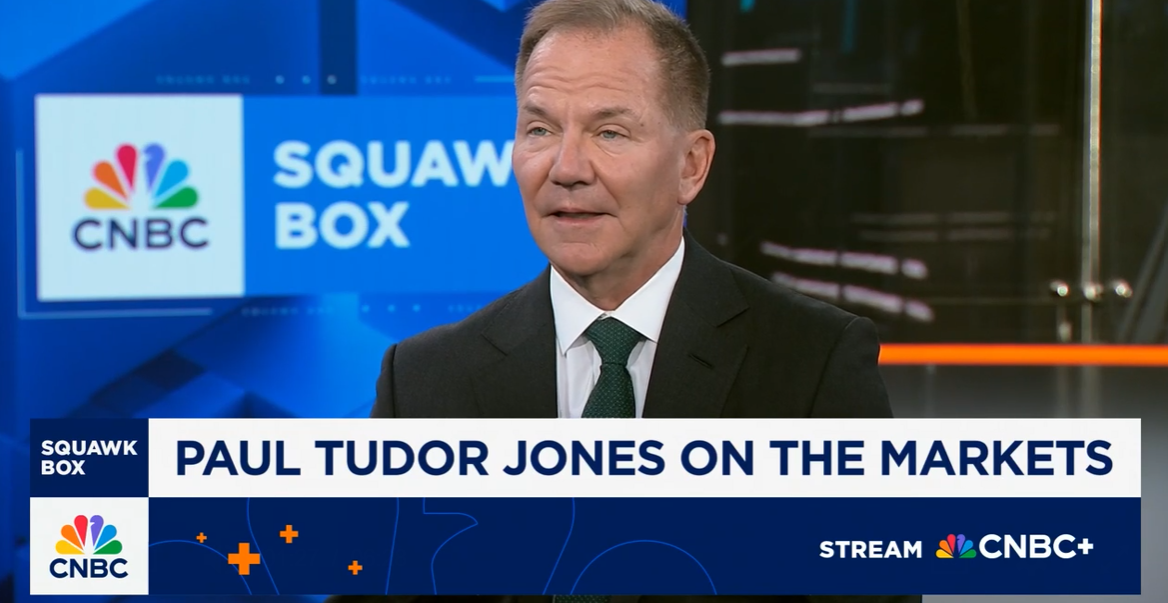
Billionaire hedge fund manager Paul Tudor Jones believes the stock market is poised for a powerful surge before reaching the final phase of its bull run.
Speaking on CNBC’s Squawk Box, the Tudor Investment founder said that today’s market setup feels strikingly similar to the one seen in late 1999, just before the dot-com bubble burst.
“My guess is that all the ingredients are in place for some kind of a blow off,” Jones said. “History rhymes a lot, so I would think some version of it is going to happen again. If anything, now is so much more potentially explosive than 1999.”
Jones pointed to rising speculation, skyrocketing technology shares, and the AI investment frenzy as key parallels to the late 1990s. He noted that circular deals and vendor financing within the artificial intelligence sector are beginning to echo the excesses that fueled the previous bubble.
However, Jones emphasized a crucial difference this time: the U.S. fiscal and monetary backdrop. With robust government spending and supportive monetary policy, he believes the bull market still has room to run before reaching its “blow-off” top.
The Nasdaq Composite, heavily weighted toward mega-cap tech companies, has already soared 55% since April, hitting consecutive record highs. The rally has been powered by investor enthusiasm for artificial intelligence and the future earnings potential of tech giants.
While Jones cautioned that speculative behavior could lead to an overheated market, his outlook suggests significant upside potential remains in the near term — particularly as investor optimism continues to build around AI-driven innovation.
Gold gains on safe-haven demand, steady US Treasury yields, and Trump’s tariffs kicking in.
Continuing Claims reach levels last seen in November 2021, fueling dovish Fed bets.
Stagflation risks emerge as inflation stays elevated while US employment weakens.
Gold price reverses its course and registers solid gains on Thursday as the latest round of jobs data in the US points to a weakening labor market. Consequently, investors increased their dovish bets as the Fed is expected to resume its easing cycle in September. The XAU/USD trades at $3,385, up 0.45%.
Earlier, the Department of Labor revealed that the number of Americans filing for unemployment benefits rose above estimates, compared to the prior print. Although the print was close to forecasts, economists’ focus shifted to Continuing Claims, which rose toward levels last seen in November 2021.
Recent weakness in the labor market, alongside higher prices, raised concerns among economists. A Bloomberg headline reads, “Stagflation Concerns Ripple Through Wall Street as Tariffs Hit”.
Bullion prices pushed higher as investors seeking safety bought the non-yielding metal, which was also underpinned by the fall of US Treasury yields.
Meanwhile, higher tariffs set by US President Donald Trump took effect on Thursday, providing a tailwind for Gold. The countries affected are Switzerland, Brazil and India, which have been unable to strike a deal with Washington.
Traders’ eyes turn to Fed officials’ speeches, with participants eyeing cues about the central bank’s next move. On the data front, the University of Michigan Consumer Sentiment for August will be unveiled, along with inflation expectations.
Daily digest market movers: Gold boosted by Continuing Claims as stagflation woes increase
US Initial Jobless Claims for the week ending August 2 rose by 228K, above estimates of 221K and the prior print of 218K. Even though the data hints at the ongoing cooling of the labor market, Continuing Claims were the main reason that investors became concerned about a stagflationary scenario. Claims increased to 1.97 million in the week ended July 26, hitting its highest level since November 2021.
Initially, the US Dollar fell, though it recovered some ground, on breaking news that the Trump administration is considering current Fed Governor Christopher Waller to become the next Fed Chair.
The US Dollar Index (DXY), which tracks the performance of the Buck’s value against a basket of its peers, is up 0.10% at 98.29. The US Dollar’s recovery capped Gold’s advance toward $3,400.
The US 10-year Treasury note yield was losing three basis points, though it has paired those losses, sitting at 4.24% unchanged though failing to cap Gold prices.
Atlanta Fed President Raphael Bostic reiterated his view that one cut is appropriate for this year but added that there is a lot of data before the next meeting.
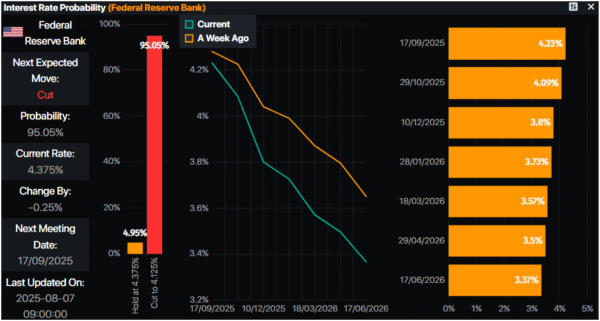
Fed Interest Rate Probabilities show that traders had priced in a 95% chance of a quarter of a percentage rate cut at the September meeting, according to Prime Market Terminal data.
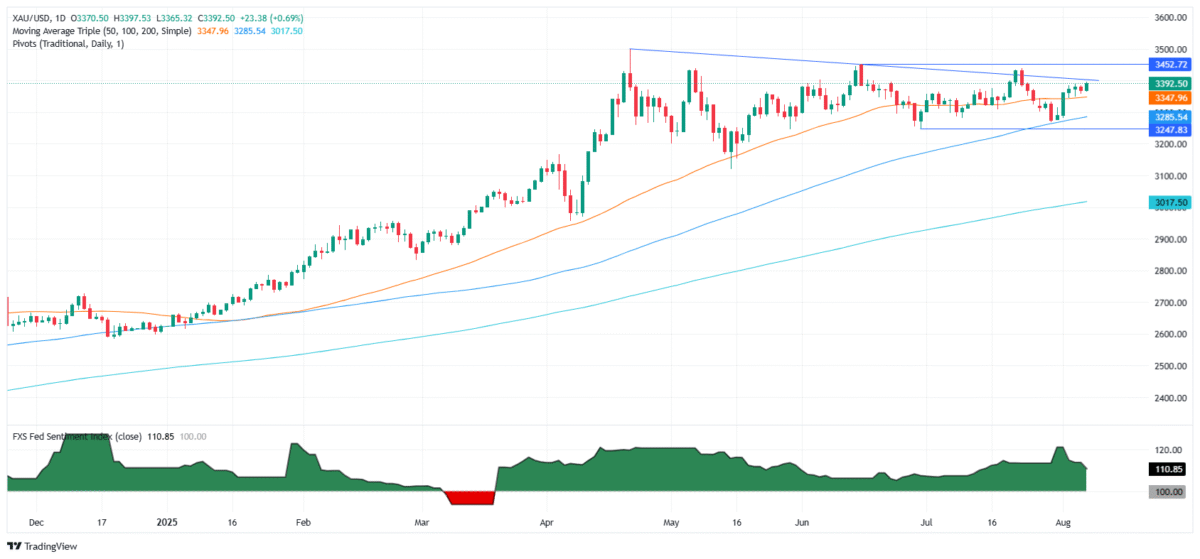
Technical outlook: Gold price remains bullish, but traders are reluctant to clear $3,400
Gold price continues to advance steadily, following the August 1 aggressive 2% gain that drove the yellow metal up from around $3,281 toward $3,363. Since then, the XAU/USD has meandered within the $3,350-$3,397 range, with buyers yet unable to crack the $3,400 figure. The Relative Strength Index (RSI) shows that bulls are in charge as the index rises, though it remains below the latest peak.
For a bullish continuation, buyers need to climb above $3,400. This clears the way to challenge June’s 16 peak at $3,452, followed by the record high of $3,500. Conversely, if XAU/USD tumbles below the confluence of the 50-day and 20-day Simple Moving Averages (SMAs) around $3,350/$3,346, expect Gold prices to slide toward the 100-day SMA at $3,275, previously breaking $3,300.
Open an account with our recommended broker with a minimum of $1000. Decide on wether to license the Swap Hunter system and get trading with one of our expert traders. Or, you can simply copy our trading account by using the MEX Atlantic Copy Trade tool. Two great options to learn about how the experts trade not using technical analysis and all that voodoo. But using data and exploiting todays interest rates and guarantee a profitable swap on your trades…EVERY DAY!
Try the Swap Hunter system with a minimum of $1000 in a trading account with MEX Atlantic using the copy trader tool. Or we can coach you to become a Swap Hunter using your own trading account with any Broker of your choice as long as it has MT4 Trading Platform.
Become a Swap Hunter and Get Your Edge Over the Markets!
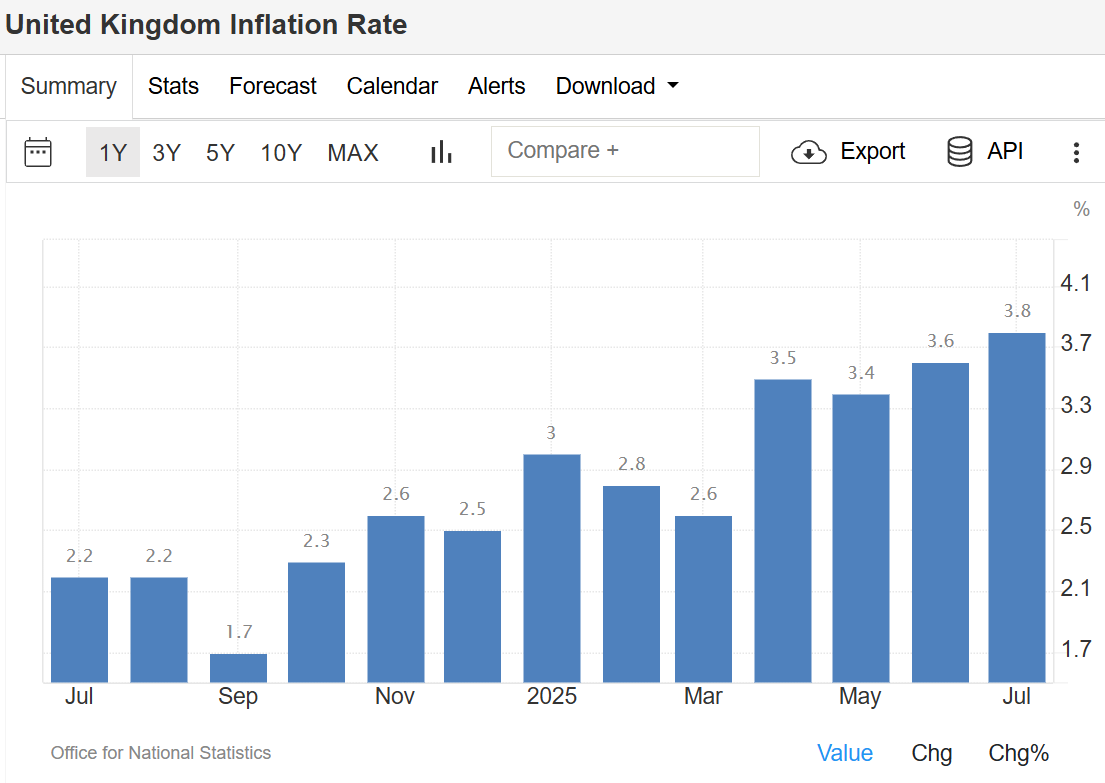
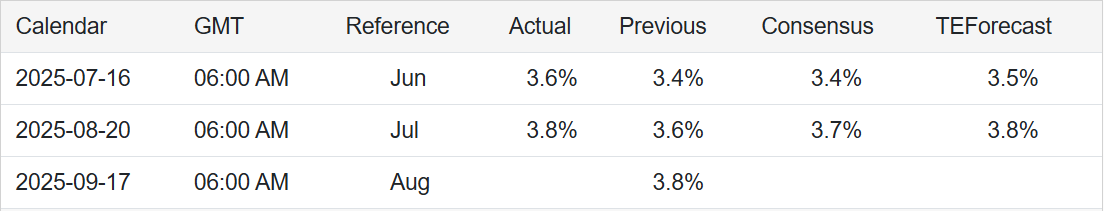
The UK inflation rate rose to 3.8% in July 2025, marking its highest level since January 2024. This was up from 3.6% in June and slightly above market forecasts of 3.7%, according to the Office for National Statistics (ONS).
The main driver of the increase came from the transport sector, where prices climbed 3.2% compared to 1.7% in June. Airfares surged by a sharp 30.2%, largely influenced by the timing of the school summer holidays. Higher motor fuel costs, sea fares, and roadside recovery services also pushed transport inflation higher.
Other notable contributors included restaurants and hotels, where prices rose 3.4% versus 2.6% in June, largely due to more expensive overnight hotel stays. Food and non-alcoholic beverages also accelerated, rising 4.9% compared to 4.5% the previous month.
On the other hand, housing and household services eased slightly, providing some relief. Inflation in this category dropped to 6.2% from 6.7%, reflecting softer growth in owner-occupiers’ housing costs and rents.
On a monthly basis, the Consumer Price Index (CPI) increased 0.1% in July, defying expectations of a 0.1% decline. However, this was slower than June’s 0.3% rise. Core inflation, which excludes energy, food, alcohol, and tobacco, also edged up to 3.8% from 3.7%. source: Office for National Statistics
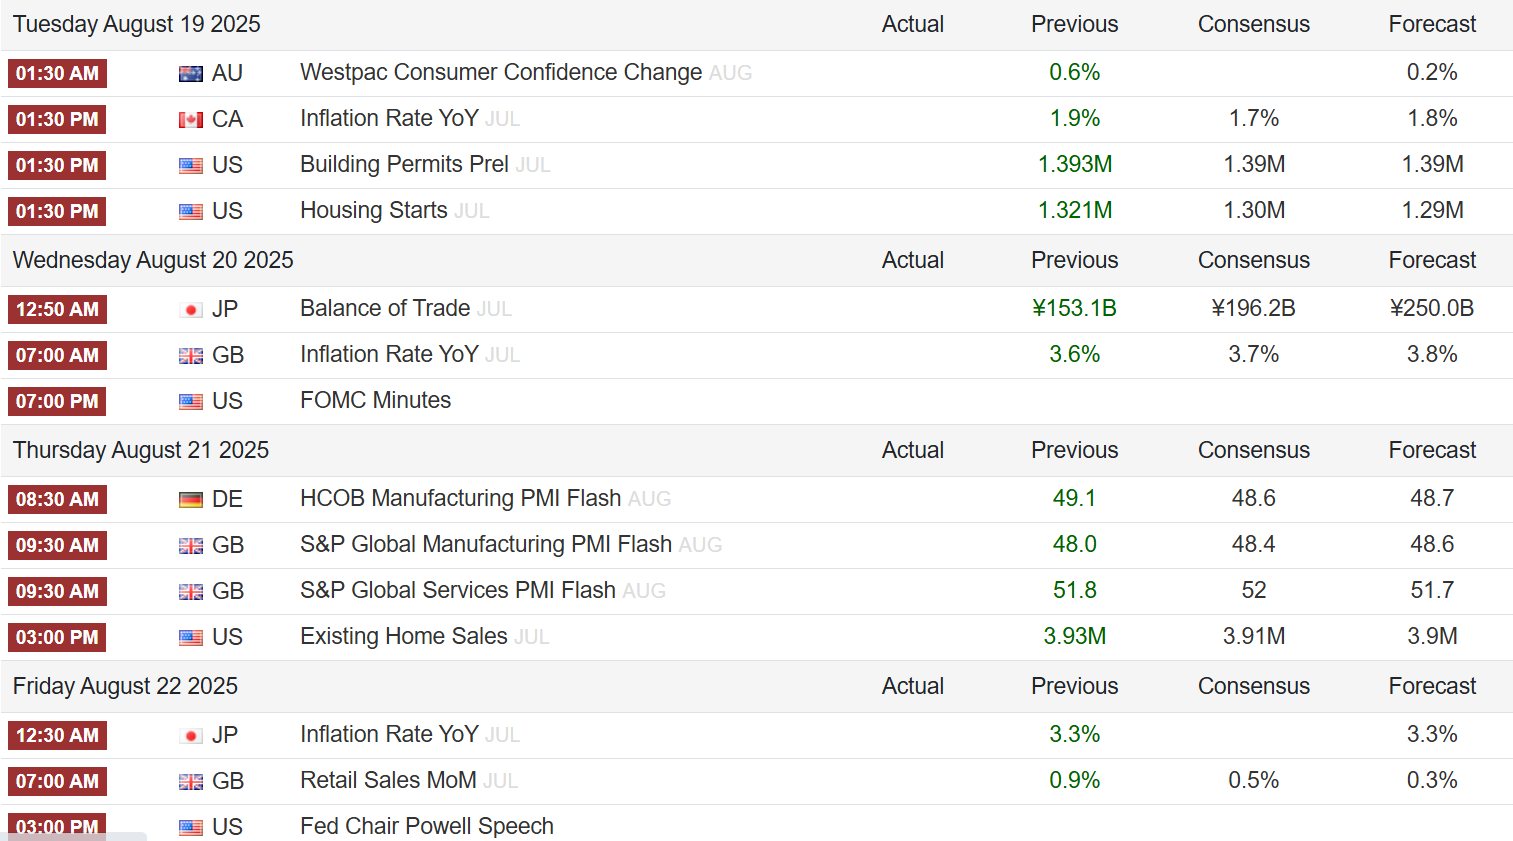
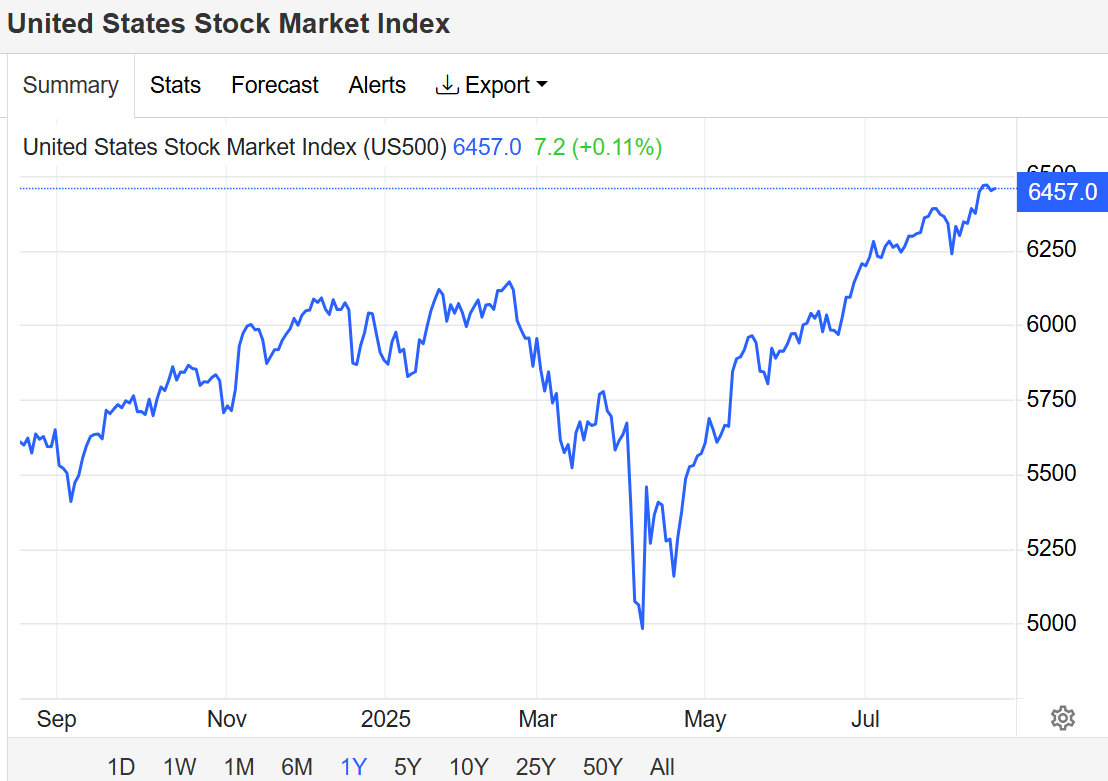
US stocks saw limited movements on Monday, with major indexes holding near their record highs from last week. The S&P 500, Nasdaq 100, and Dow Jones Industrial Average all traded flat as investors awaited fresh catalysts, particularly from:
The Federal Reserve’s FOMC meeting minutes
The Jackson Hole Symposium later this week
Both are expected to offer hints on the Fed’s interest rate outlook.
Trade these data points with Swap Hunter by your side and you are going to have an edge on your Broker, your Bank and your Colleagues.
Equities remain supported by growing bets on multiple rate cuts this year, as markets respond to signs of a softening labor market and disinflation pressures.
Key Market Highlights:
Chipmakers and AI-exposed stocks climbed, with Nvidia (+0.5%) staying near record highs despite recent US export controls.
Retail stocks were mixed ahead of upcoming quarterly earnings reports.
Geopolitical backdrop: EU leaders prepared to meet Ukraine’s President Zelensky following US President Trump’s summit with Russian President Putin.
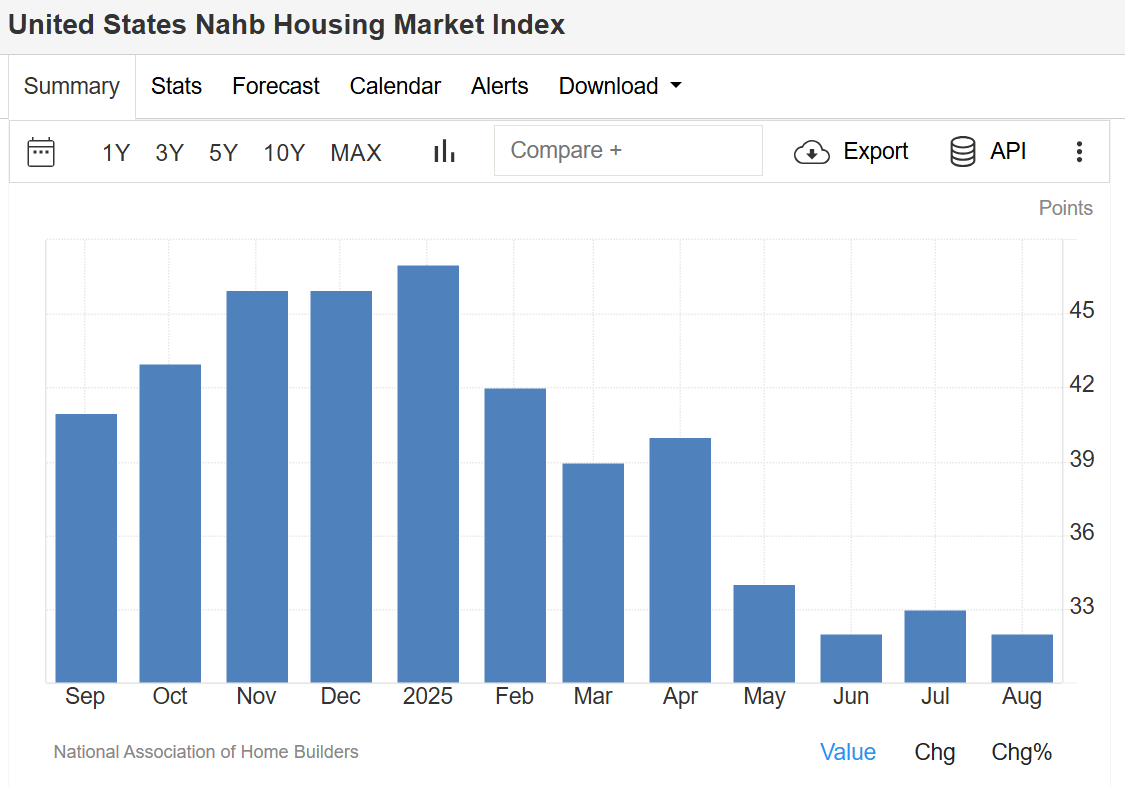
NAHB Housing Market Index – August 2025
The NAHB/Wells Fargo Housing Market Index (HMI) slipped to 32 in August 2025, down from 33 in July and below expectations of 34, signaling persistent challenges in the housing sector.
Breakdown of Housing Data:
Current sales conditions: fell one point to 35
Sales expectations (next 6 months): steady at 43
Buyer traffic: rose two points to 22, still at historically low levels
Builder Incentives & Pricing Trends:
37% of builders cut prices in August (down from 38% in July)
Average price reduction remained at 5% for the tenth straight month
66% of builders used sales incentives, the highest post-Covid level, up from 62% in July
This data reflects ongoing affordability concerns, limited buyer demand, and sustained reliance on incentives to stimulate sales. source: National Association of Home Builders
Stock Market: Investors remain cautious but optimistic, balancing AI-driven growth and monetary policy expectations.
Housing Market: Persistent weakness in builder confidence highlights the impact of affordability challenges, even as incentives expand.
📊 Both markets remain heavily influenced by Federal Reserve policy signals, making this week’s Jackson Hole Symposium a pivotal event for investors and analysts.
Frequently Asked Questions (FAQ)
1. What is the current United States Stock Market Index level in August 2025?
In August 2025, the S&P 500, Nasdaq 100, and Dow Jones remain near record highs after a strong rally earlier in the month. Markets are currently trading flat as investors await signals from the Federal Reserve’s policy outlook.
2. Why are US stocks trading flat despite strong AI and chipmaker performance?
While AI-related stocks like Nvidia continue to perform strongly, overall market movement is subdued due to uncertainty over the Federal Reserve’s interest rate decisions. Investors are waiting for clarity from the Jackson Hole Symposium and FOMC meeting minutes.
3. What does the NAHB Housing Market Index measure?
The NAHB/Wells Fargo Housing Market Index (HMI) measures builder confidence in the housing market, covering current sales, buyer traffic, and future sales expectations. A reading above 50 indicates optimism, while below 50 reflects weakness.
4. Why did the NAHB Housing Market Index fall in August 2025?
The index fell to 32 in August 2025 due to weak buyer demand, affordability challenges, and higher reliance on sales incentives and price cuts by builders.
5. Are US home builders offering more incentives in 2025?
Yes. In August 2025, 66% of builders reported using sales incentives, the highest since the post-Covid period. Price cuts remain common, with an average reduction of 5% per home.
Technical Analysis: S&P 500 – August 2025
The S&P 500 continues to hover near record highs after its sharp rally this summer. Momentum remains strong, but the index is showing signs of consolidation as traders await policy signals from the Federal Reserve.
Key Technical Levels
Resistance Zone: 5,650 – 5,700 → The index is struggling to break above this level, marking a potential short-term ceiling.
Support Levels:
5,500 (near-term support) – A break below could invite short-term selling.
5,350 (major support) – A key level to watch, aligning with the 50-day moving average (50-DMA).
Moving Averages
50-Day Moving Average (50-DMA): ~5,350 – Currently acting as strong dynamic support.
200-Day Moving Average (200-DMA): ~4,950 – Well below current levels, confirming a longer-term bullish trend.
Momentum Indicators
RSI (Relative Strength Index): Hovering around 64, just below the overbought threshold (70). This suggests the index is consolidating but not yet in danger of a deep correction.
MACD (Moving Average Convergence Divergence): Still in positive territory, though momentum is flattening, pointing to a possible range-bound movement in the short term.
Chart Outlook
The S&P 500 remains bullish in the medium to long term, supported by AI-driven growth and easing inflation expectations. However, short-term consolidation is likely until traders get more clarity from Fed policy announcements.
Trading Strategy (Not Financial Advice):
Bullish bias above 5,500 support
Watch for a breakout above 5,700 for continuation toward new record highs
Caution: A sustained break below 5,350 could trigger deeper pullbacks
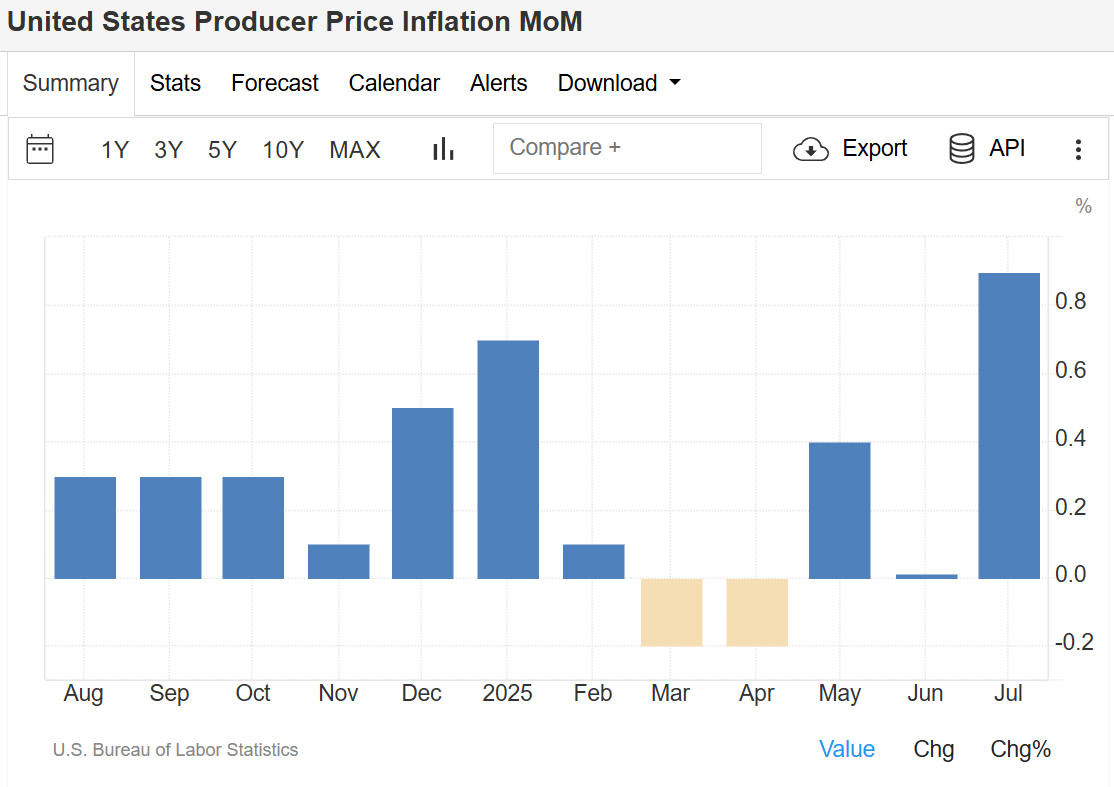
The US Producer Price Index (PPI) for July 2025 surged 0.9% month-over-month, marking the sharpest increase since June 2022. This rebound from June’s flat reading easily beat market forecasts of a 0.2% rise, highlighting stronger-than-expected inflation pressures.
Services costs led the gain, climbing 1.1% in July. The biggest driver was a 3.8% jump in margins for machinery and equipment wholesaling, with additional increases in portfolio management, securities brokerage, investment advisory services, traveler accommodations, automobile retailing, and truck freight transportation.
Goods prices also rose 0.7%, fueled by a staggering 38.9% surge in fresh and dry vegetable prices. Other contributors included higher costs for meats, diesel fuel, jet fuel, nonferrous scrap, and eggs, partially offset by a 1.8% drop in gasoline.
The core Producer Price Index—excluding food and energy—also climbed 0.9%, far above the expected 0.2%.
On a yearly basis, headline producer inflation accelerated to 3.3%, the highest in five months, while core PPI jumped to 3.7% from 2.6% in June. Both figures came in well above analyst expectations, potentially complicating the Federal Reserve’s path toward interest rate cuts later this year. Source: U.S. Bureau of Labor Statistics
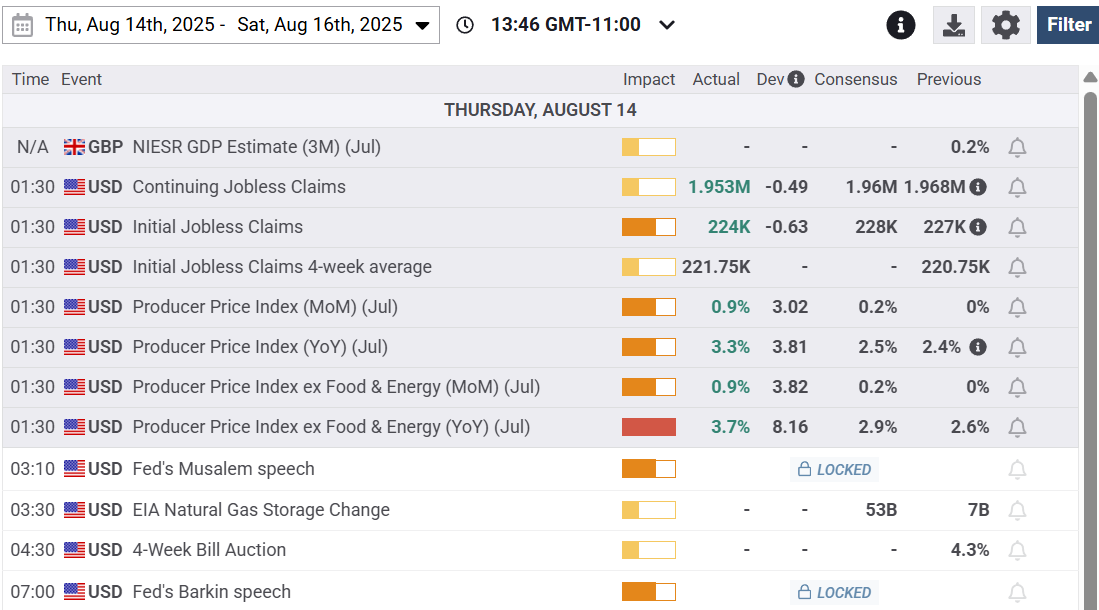
Economic Calendar Displaying todays PPI data and Jobs data.
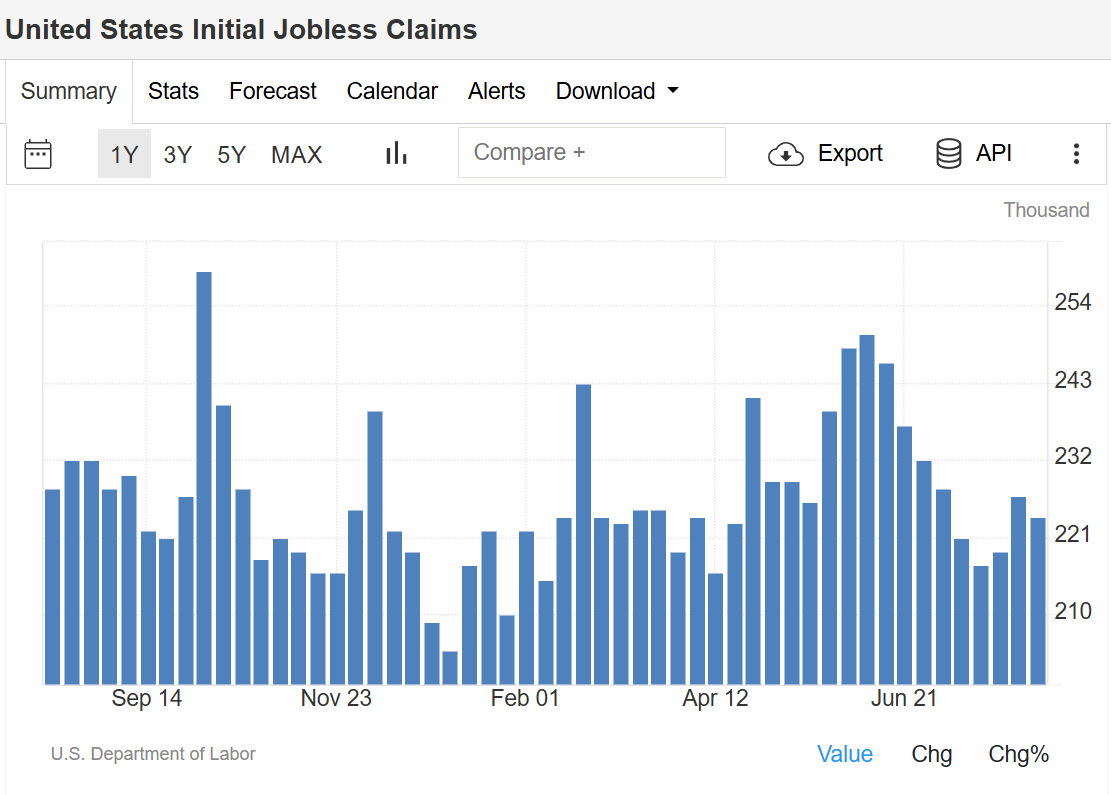
📉 US Jobless Claims Fall More Than Expected
U.S. initial jobless claims slipped to 224,000 in early July 2025, down 3,000 from the prior week and below forecasts of 228,000. Continued claims eased by 15,000 to 1.953 million, retreating from a three-year high.
The labor market remains solid despite signs of slowing, with hiring cooling and payroll figures recently revised lower. Federal government employee claims—closely watched after DOGE layoffs—fell by 71 to 637. source: U.S. Department of Labor
All this points to a stronger USD. But we think it will retrace pretty quickly. Get ready for some “whipsaw” action later in todays trading session and coming days.
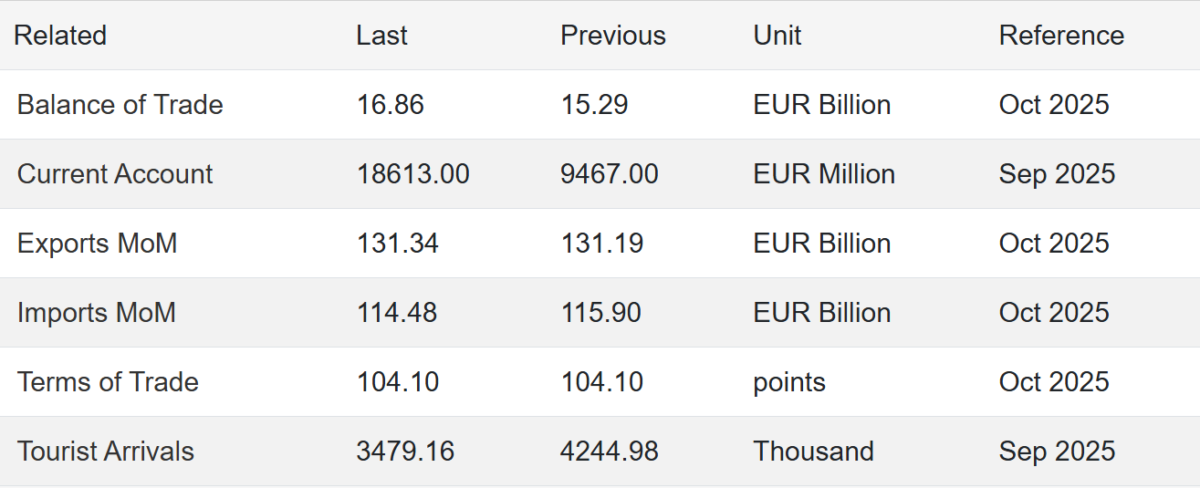
Australian Dollar Leads Gains, Asian Currencies Slip
The foreign exchange market saw notable movement today, with the Australian Dollar (AUD) emerging as the top gainer, while several Asian currencies faced pressure. Here’s a breakdown of the latest action:
🔼 Top Currency Gainers
🇦🇺 Australian Dollar (AUD) – +0.30%
The AUD surged on the back of robust trade data and stronger commodity prices, outpacing its peers in today’s session.
💵 Dollar Index (DXY) – +0.02%
The U.S. Dollar index posted a modest gain as traders remain cautious ahead of upcoming U.S. labor market reports later this week.
🔽 Top Currency Losers
🇰🇷 South Korean Won (KRW) – -0.26%
The KRW dropped the most among major currencies due to export concerns and regional geopolitical uncertainty.
🇯🇵 Japanese Yen (JPY) – -0.18%
The JPY weakened as the Bank of Japan stays committed to its ultra-loose monetary stance.
🇬🇧 British Pound (GBP) – -0.10%
The GBP slipped after soft inflation data led traders to price in a more dovish outlook from the Bank of England.
🇪🇺 Euro (EUR) – -0.03%
The Euro edged slightly lower amid mixed eurozone data and cautious signals from the European Central Bank (ECB).
📊 FX Performance Summary
Currency
Change (%)
Movement
🇦🇺 AUD
+0.30%
Strong Gain
💵 DXY
+0.02%
Mild Upside
🇪🇺 EUR
-0.03%
Slight Decline
🇬🇧 GBP
-0.10%
Weakening
🇯🇵 JPY
-0.18%
Under Pressure
🇰🇷 KRW
-0.26%
Sharp Decline
💬 Market Outlook
With commodity markets holding firm and economic data rolling in, traders will continue watching central bank policy cues and geopolitical developments. The AUD’s strength may persist if risk sentiment remains positive, while Asian currencies may stay under pressure without regional economic improvement.
📝 Stay Updated
Join our Telegram Channel or on WhatsApp for real-time market insights, chart analysis, and strategy tips.
You can also register your details in this form to stay updated with our Trading Activities and strategies.
Open an Account with our Recommended Broker and get ongoing training and support using Swap Hunter, Market analysis, Strategy assistance and coaching or a fully Managed Account through Copy Trading or PAMM Solutions. Just click on image below and register your Trading account today.
Click on Image to Register with Top Broker in the Industry
Excerpt: The CBI’s retail sales index rose slightly in July 2025 but stayed weaker than expected, showing UK retailers are still battling tough economic conditions. Meanwhile, Hong Kong’s import growth slowed in June as demand shifted across sectors and trading partners.
📉 UK Retail Sales: Modest Improvement in July
The Confederation of British Industry’s (CBI) latest monthly retail sales gauge brought a hint of relief for UK retailers. The index climbed to -34 in July, improving from June’s 17-month low of -46. However, this figure still missed analysts’ expectations of -26, underlining how high prices and ongoing economic uncertainty continue to drag on consumer spending.
Retail sales volumes have now fallen for ten consecutive months, reflecting the squeeze on household budgets. Looking ahead, retailers are slightly more optimistic about August, with the measure of expected sales rising to -31, compared to -49 a month earlier.
🌏 Hong Kong Imports: Growth Cools in June
Hong Kong’s imports climbed 11.1% year-on-year to $476.7 billion in June 2025, according to the Census and Statistics Department. While this marks another month of growth, it was the slowest rate in five months, down from May’s sharp 18.9% rise.
Imports surged from Vietnam (+50.6%), the United Kingdom (+44.7%), mainland China (+17.3%), Thailand (+15.9%) and the United States (+3.9%). However, imports from South Korea saw a sharp decline (-27.1%).
By product category, there were broad gains in key sectors:
Electrical machinery, apparatus and parts rose 14.6% (vs 23.7% in May)
Telecommunications equipment increased 17.7%
Office machines and data processing equipment rose 9.8%
Miscellaneous manufactured articles grew 12.6%
Power-generating machinery jumped 38.7%
In contrast, declines were recorded for non-metallic mineral manufactures (-15.6%), professional and scientific instruments (-9.4%) and petroleum-related products (-10.5%).
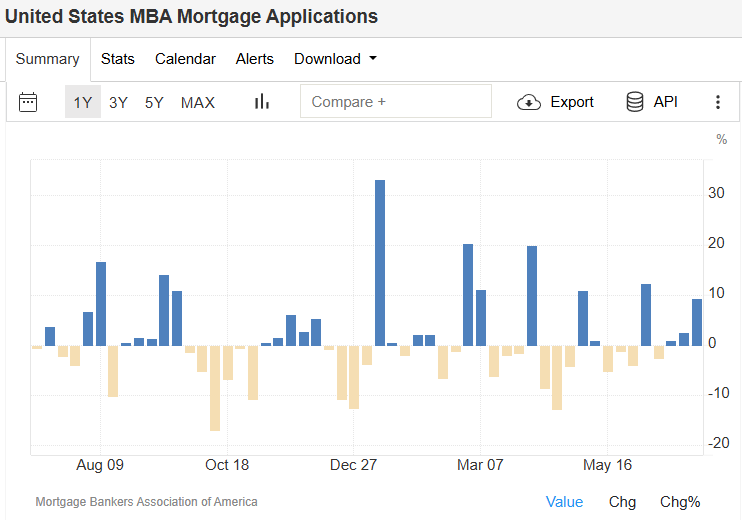
Mortgage Applications See Strongest Weekly Rise in a Month
In the first week of July 2025, the volume of U.S. mortgage applications soared by 9.4% from the previous week — the largest increase in a month, according to data from the Mortgage Bankers Association. This marks the third consecutive weekly gain, the longest streak since December 2024, as benchmark mortgage rates dipped to their lowest since April.
Refinancing activity, which tends to respond quickly to changes in short-term rates, jumped 9% week-over-week and surged 56% compared to the same period in 2024. Similarly, purchase applications rose 9% on the week and were up 25% year-over-year, highlighting renewed strength in the housing market. source: Mortgage Bankers Association of America
Markets Edge Higher on Trade Announcements and Fed Speculation
U.S. equities closed higher on Wednesday as traders digested updates on trade policy and awaited the Federal Reserve’s next moves. The S&P 500 gained 0.5%, the Nasdaq climbed 0.7%, and the Dow Jones rose by nearly 200 points.
President Trump signaled that major trade announcements would be made, including a planned 50% tariff on copper imports and potential 200% tariffs on pharmaceuticals, though implementation is delayed by 12–18 months to give industries time to adapt.
Market participants are closely watching for the FOMC minutes release, which may offer insights into the timing of potential interest rate cuts. Expectations remain strong for two 25 basis point cuts before year-end.
Technology stocks led gains, with Nvidia up 2.2% and Microsoft rising 1.2%. Apple shares were flat, following a statement by White House Trade Counselor Peter Navarro suggesting the company considers itself “too big to tariff.”
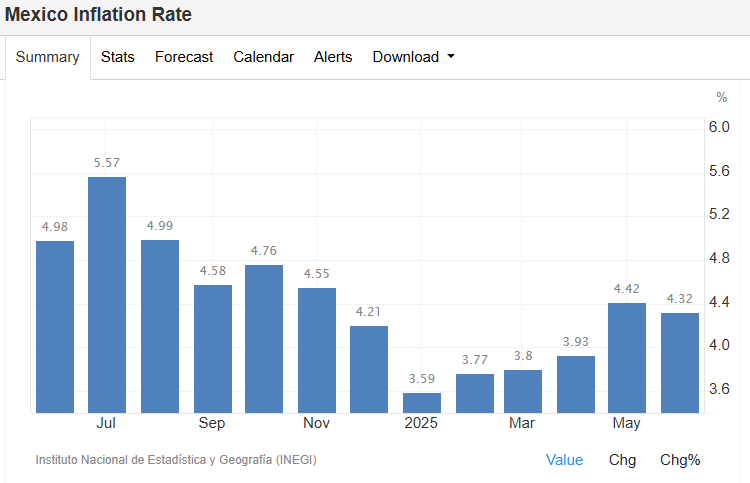
Mexico’s Inflation Slows but Core Pressures Rise
Mexico’s annual inflation rate eased to 4.32% in June 2025, down slightly from 4.42% in May, aligning closely with market expectations of 4.31%, according to the national statistics agency INEGI.
Price growth moderated in agriculture (5.04% vs 6.76%) and energy (3.56% vs 3.93%), while accelerating for goods, food, beverages, and services. Notably, core inflation ticked up to 4.24%, suggesting that underlying price pressures remain sticky.
With falling mortgage rates energizing the U.S. housing market, equity markets buoyed by trade policy hints, and inflation trends in Mexico showing mixed signals, July 2025 is shaping up to be a pivotal month for both investors and policymakers.
Stay tuned for more updates on monetary policy, inflation data, and global economic trends.