US equities were mostly flat as traders awaited the Federal Reserve’s interest-rate decision.
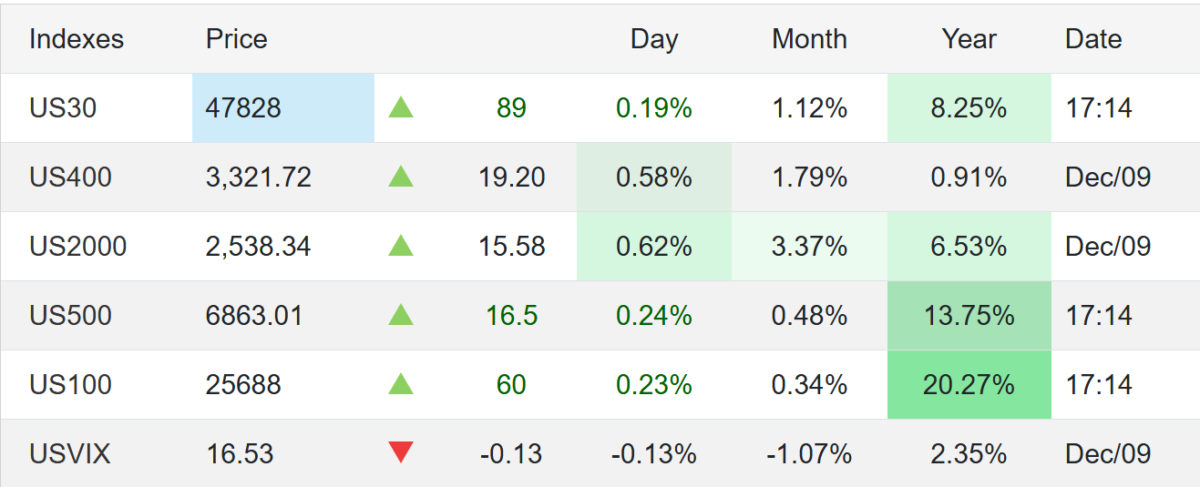
S&P 500: +0.1%
Dow Jones: +90 points
Nasdaq: Near unchanged
Expectations: Markets are widely pricing in a 25 bp rate cut on Wednesday. Focus is shifting to the Fed’s updated economic projections, especially regarding the pace of policy easing in 2026.
Labor Market
JOLTS (Sept & Oct): Job openings came in above expectations, signaling still-firm demand for labor.
ADP employment (weekly average through Nov 22):
Private employers added ~4,750 jobs per week, ending three straight periods of declines.
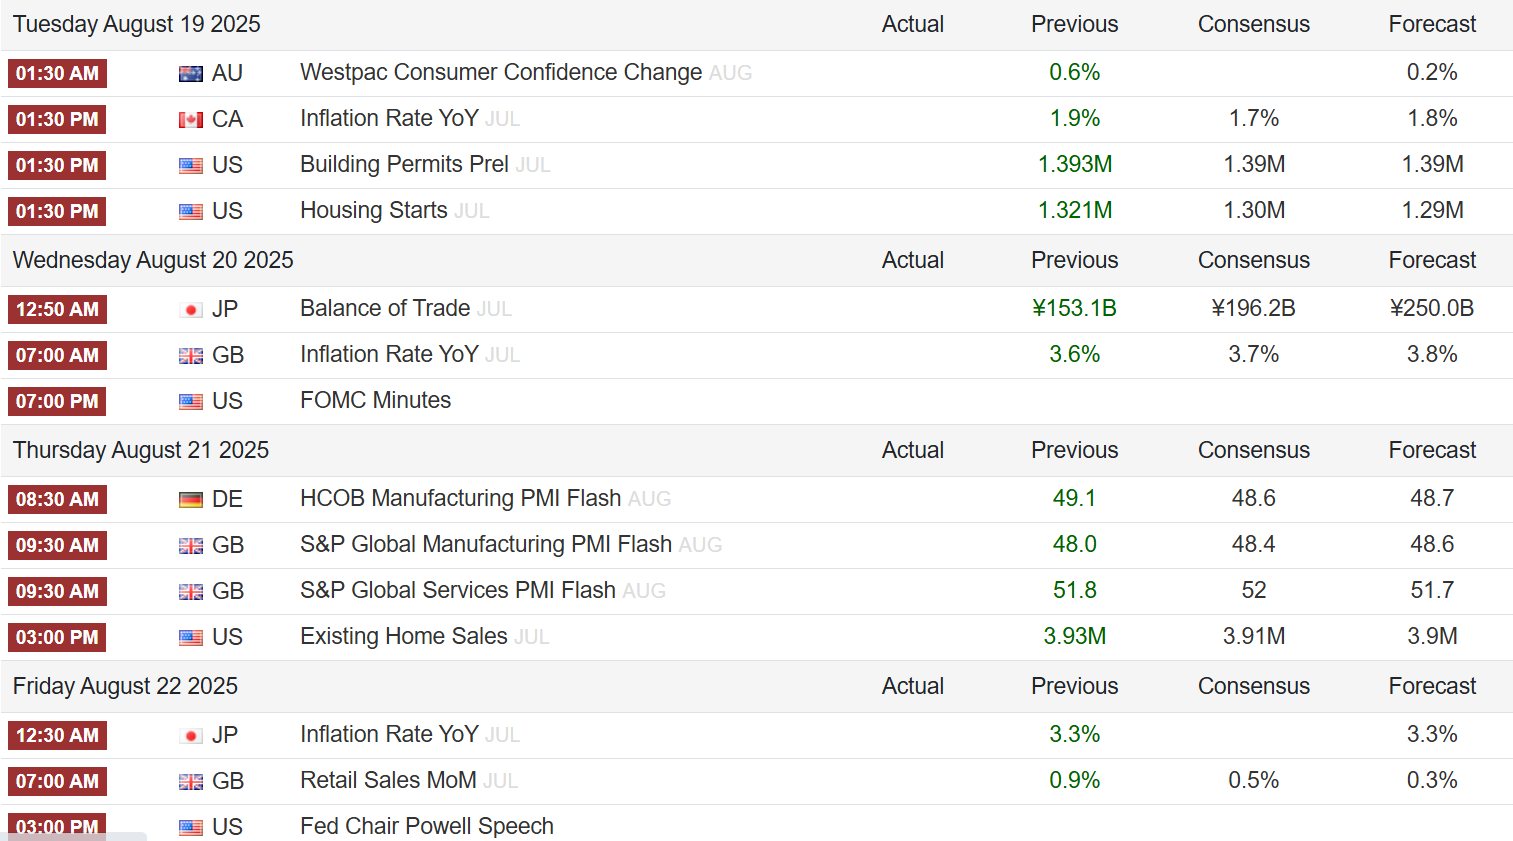
US stocks saw limited movements on Monday, with major indexes holding near their record highs from last week. The S&P 500, Nasdaq 100, and Dow Jones Industrial Average all traded flat as investors awaited fresh catalysts, particularly from:
The Federal Reserve’s FOMC meeting minutes
The Jackson Hole Symposium later this week
Both are expected to offer hints on the Fed’s interest rate outlook.
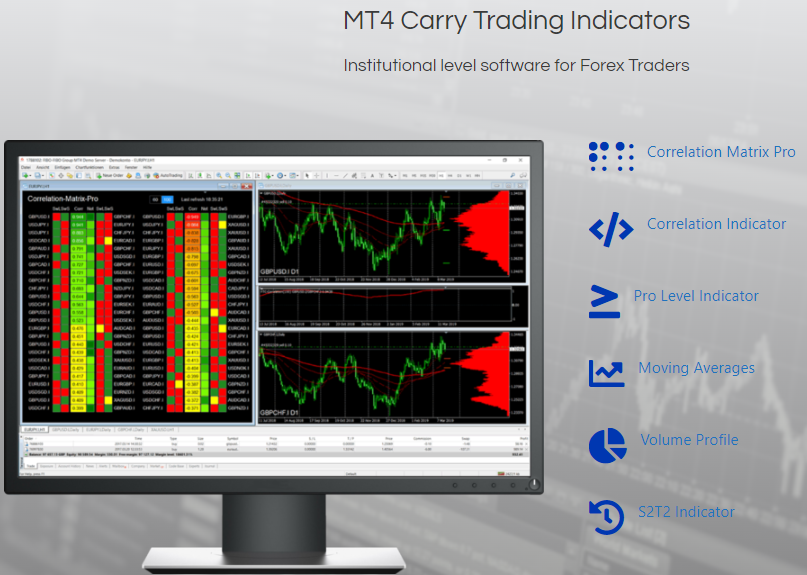
Trade these data points with Swap Hunter by your side and you are going to have an edge on your Broker, your Bank and your Colleagues.
Equities remain supported by growing bets on multiple rate cuts this year, as markets respond to signs of a softening labor market and disinflation pressures.
Key Market Highlights:
Chipmakers and AI-exposed stocks climbed, with Nvidia (+0.5%) staying near record highs despite recent US export controls.
Retail stocks were mixed ahead of upcoming quarterly earnings reports.
Geopolitical backdrop: EU leaders prepared to meet Ukraine’s President Zelensky following US President Trump’s summit with Russian President Putin.
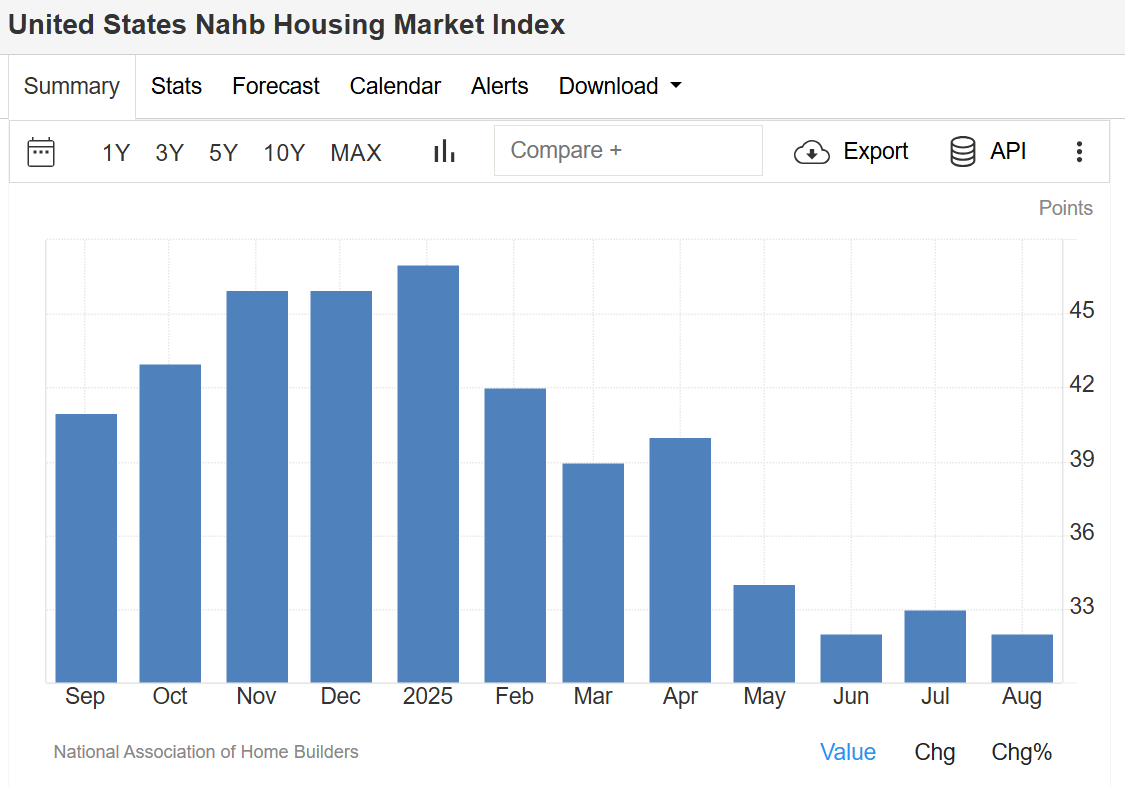
NAHB Housing Market Index – August 2025
The NAHB/Wells Fargo Housing Market Index (HMI) slipped to 32 in August 2025, down from 33 in July and below expectations of 34, signaling persistent challenges in the housing sector.
Breakdown of Housing Data:
Current sales conditions: fell one point to 35
Sales expectations (next 6 months): steady at 43
Buyer traffic: rose two points to 22, still at historically low levels
Builder Incentives & Pricing Trends:
37% of builders cut prices in August (down from 38% in July)
Average price reduction remained at 5% for the tenth straight month
66% of builders used sales incentives, the highest post-Covid level, up from 62% in July
This data reflects ongoing affordability concerns, limited buyer demand, and sustained reliance on incentives to stimulate sales. source: National Association of Home Builders
Stock Market: Investors remain cautious but optimistic, balancing AI-driven growth and monetary policy expectations.
Housing Market: Persistent weakness in builder confidence highlights the impact of affordability challenges, even as incentives expand.
📊 Both markets remain heavily influenced by Federal Reserve policy signals, making this week’s Jackson Hole Symposium a pivotal event for investors and analysts.
Frequently Asked Questions (FAQ)
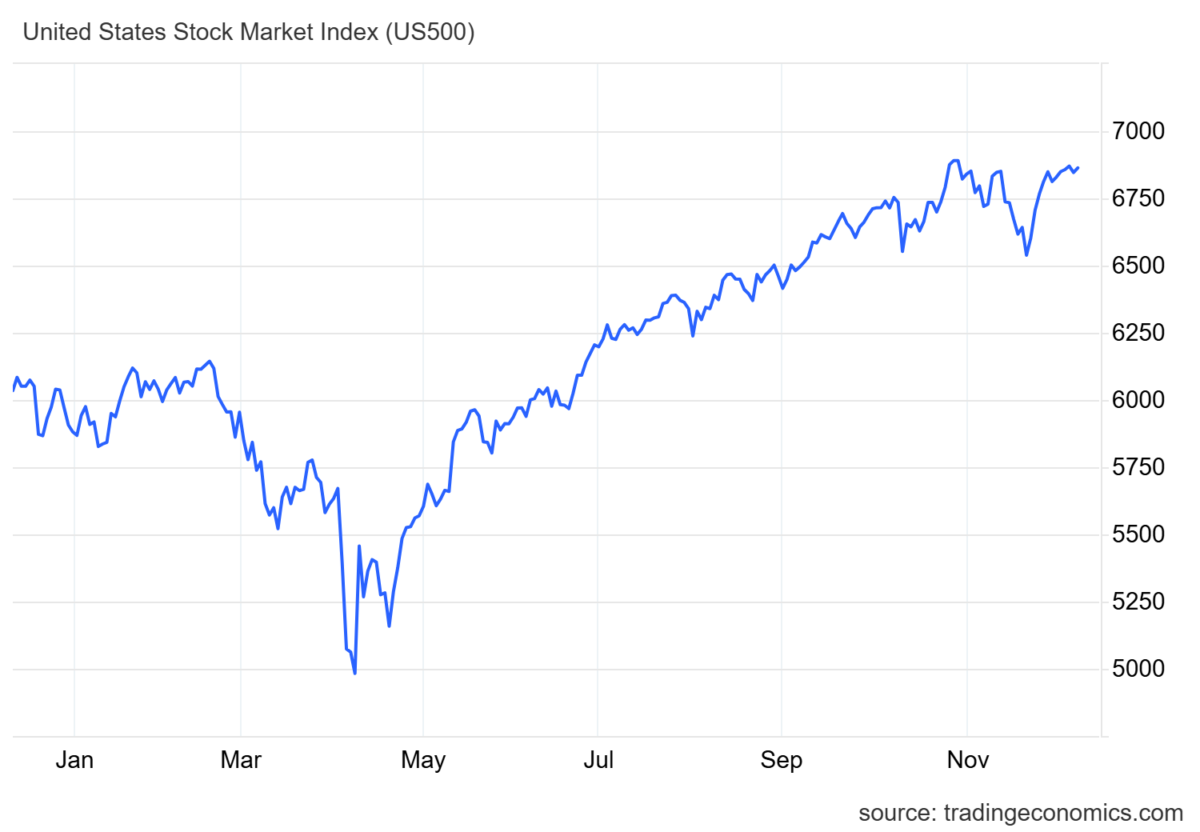
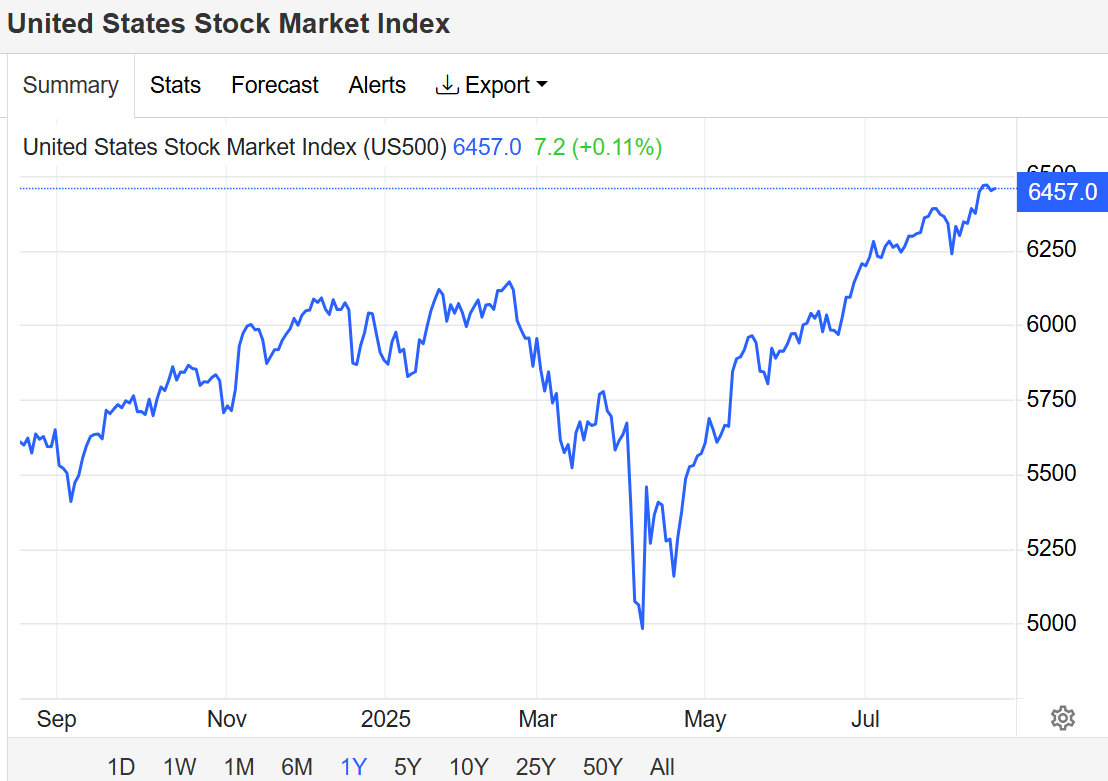
1. What is the current United States Stock Market Index level in August 2025?
In August 2025, the S&P 500, Nasdaq 100, and Dow Jones remain near record highs after a strong rally earlier in the month. Markets are currently trading flat as investors await signals from the Federal Reserve’s policy outlook.
2. Why are US stocks trading flat despite strong AI and chipmaker performance?
While AI-related stocks like Nvidia continue to perform strongly, overall market movement is subdued due to uncertainty over the Federal Reserve’s interest rate decisions. Investors are waiting for clarity from the Jackson Hole Symposium and FOMC meeting minutes.
3. What does the NAHB Housing Market Index measure?
The NAHB/Wells Fargo Housing Market Index (HMI) measures builder confidence in the housing market, covering current sales, buyer traffic, and future sales expectations. A reading above 50 indicates optimism, while below 50 reflects weakness.
4. Why did the NAHB Housing Market Index fall in August 2025?
The index fell to 32 in August 2025 due to weak buyer demand, affordability challenges, and higher reliance on sales incentives and price cuts by builders.
5. Are US home builders offering more incentives in 2025?
Yes. In August 2025, 66% of builders reported using sales incentives, the highest since the post-Covid period. Price cuts remain common, with an average reduction of 5% per home.
Technical Analysis: S&P 500 – August 2025
The S&P 500 continues to hover near record highs after its sharp rally this summer. Momentum remains strong, but the index is showing signs of consolidation as traders await policy signals from the Federal Reserve.
Key Technical Levels
Resistance Zone: 5,650 – 5,700 → The index is struggling to break above this level, marking a potential short-term ceiling.
Support Levels:
5,500 (near-term support) – A break below could invite short-term selling.
5,350 (major support) – A key level to watch, aligning with the 50-day moving average (50-DMA).
Moving Averages
50-Day Moving Average (50-DMA): ~5,350 – Currently acting as strong dynamic support.
200-Day Moving Average (200-DMA): ~4,950 – Well below current levels, confirming a longer-term bullish trend.
Momentum Indicators
RSI (Relative Strength Index): Hovering around 64, just below the overbought threshold (70). This suggests the index is consolidating but not yet in danger of a deep correction.
MACD (Moving Average Convergence Divergence): Still in positive territory, though momentum is flattening, pointing to a possible range-bound movement in the short term.
Chart Outlook
The S&P 500 remains bullish in the medium to long term, supported by AI-driven growth and easing inflation expectations. However, short-term consolidation is likely until traders get more clarity from Fed policy announcements.
Trading Strategy (Not Financial Advice):
Bullish bias above 5,500 support
Watch for a breakout above 5,700 for continuation toward new record highs
Caution: A sustained break below 5,350 could trigger deeper pullbacks
WTI crude oil, gold prices, and the US dollar index all moved significantly on Thursday as geopolitical developments, Fed policy signals, and economic data shaped market sentiment.
Crude Oil Prices Rise Ahead of US–Iran Talks and OPEC+ Meeting
WTI crude oil futures climbed above $65 per barrel on Thursday, building on recent gains and recovering from earlier losses in the week. The rally comes as investors await high-stakes talks between the US and Iran scheduled for next week. These discussions aim to reduce tensions in the Middle East and limit Tehran’s nuclear ambitions.
The move follows President Trump’s reaffirmation of the maximum pressure campaign, including restrictions on Iranian oil exports. However, he also hinted at possible enforcement leniency to support Iran’s reconstruction, suggesting China may continue importing Iranian crude.
In a sign of strong demand, US crude inventories dropped by 5.8 million barrels, reaching an 11-year seasonal low. Cushing stockpiles also fell to the lowest since February.
Markets are now turning their focus to the upcoming OPEC+ meeting on July 6, where the group will set its production policy for August. Russia may support a supply increase if conditions warrant it.
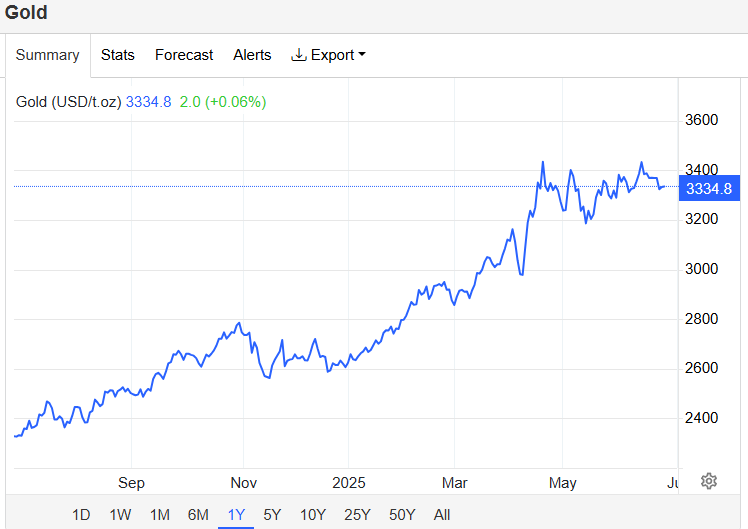
Gold Prices Edge Higher on Weaker Dollar, Geopolitical Relief
Gold prices rose toward $3,340 per ounce, extending gains from the previous session. The weaker US dollar and falling Treasury yields provided support, while easing geopolitical tensions added a further boost.
Next week’s US–Iran talks have sparked cautious optimism in markets. While the ceasefire between Iran and Israel is holding, concerns about its durability remain.
Meanwhile, Fed Chair Jerome Powell, in his second day of testimony, maintained a balanced stance—acknowledging inflation risks from tariffs but holding off on immediate rate cuts. Nonetheless, weak consumer confidence in June raised fresh concerns about the labor market and trade uncertainty, potentially strengthening the case for future easing.
Markets are now closely watching key data, including Thursday’s final Q1 GDP reading and initial jobless claims, followed by PCE price data on Friday.
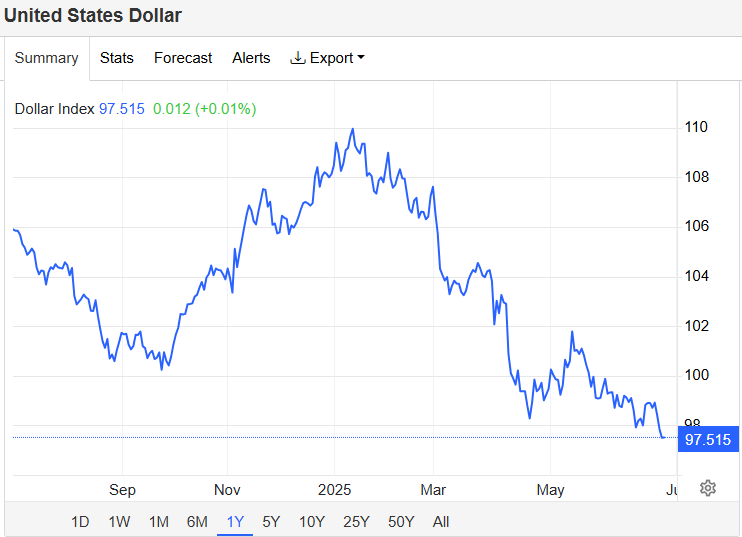
US Dollar Slides to Three-Year Low Amid Rate Cut Expectations
The US dollar index fell to around 97.5, marking its lowest level in over three years. The decline reflects a mix of easing geopolitical tensions, growing fiscal worries, and expectations of Federal Reserve rate cuts.
With the ceasefire between Iran and Israel seemingly stable and US–Iran negotiations on the horizon, risk sentiment improved. On the policy front, Chair Powell reiterated a cautious stance, stating that while tariffs may drive inflation, the Fed would likely continue easing absent those pressures.
Traders are now pricing in over 60 basis points of rate cuts by year-end, with the next move anticipated in September. Attention is also turning to US trade negotiations ahead of President Trump’s July 9 deadline, and efforts in Congress to finalize a tax and spending package around the same period.
Looking Ahead
Markets are poised for more volatility as geopolitical, economic, and policy developments continue to unfold. Investors should watch closely for:
US–Iran nuclear talks next week
July 6 OPEC+ meeting outcomes
Upcoming US economic data (GDP, jobless claims, PCE)
Fed policy signals amid global trade uncertainty
Stay tuned for further updates as these stories evolve.
Fill out the registration form below to receive a FREE consultation from Swap Hunter
Open your Trading Account with MEX Atlantic, part of the MultiBank Group