Silver Price Forecast: XAG/USD Retreats Below $38.50 Amid Dollar Strength

Silver (XAG/USD) is pulling back after touching recent highs above $39.00. Now trading below $38.50 as the US Dollar extends its rally. The decline comes as the US Dollar Index (DXY) posts gains for the fourth consecutive session.

Supported by a weak Euro amid political turmoil in France.

Although markets remain cautious about the Federal Reserve’s independence and rising expectations of rate cuts, the Greenback’s resilience is keeping precious metals under pressure.


Technical Analysis: $38.35 Support Key for Silver Bears

Silver Technical Analysis

From a technical perspective, XAG/USD shows a bearish correction from last week’s one-month high at $39.07. Price action is testing support at $38.35 (August 25–26 lows).

  • A break below $38.35 could drag Silver toward the August 22 low at $37.70, with the next support at $37.25, the lower boundary of the ascending channel.
  • On the upside, immediate resistance lies near $38.75 and $38.85, followed by the August 22 high at $39.10 and July 22 high at $39.55.

Outlook for Traders

Silver traders should closely watch the $38.35 support zone. A downside break may accelerate bearish momentum, while a rebound above $38.75 could bring back buyers targeting $39.10 and beyond.

For now, Dollar strength remains the dominant driver, leaving Silver vulnerable to further declines.

Trade Silver with MEX Atlantic Multibank Group. Best Spreads in the Industry, Ongoing Support and Training from the Swap Hunter Team!

open an Account with MEX Atlantic part of MultiBank Group

Register an account and invest $5000 with our Recommended Broker to get 3 months Swap Hunter license and 10 Training Sessions.

Find out for yourself how Carry Trading using Swap Hunter strategies will give you an edge over the Market.

    First Name (required)

    Last Name (required)

    Your Email (required)

    Preferred Method of Contact (required)
    eMailPhoneSkypeWhatsApp/Viber/Telegram,etc.

    Your Phone (required)

    Your Mobile

    Your Skype

    Category (required)

    Subject (required)

    Your Message (required)

    I am interested in (tick all that apply):

    GDPR Agreement*
    See our privacy policy to learn more about how we use data.

    Silver Price Forecast: XAG/USD Rebounds from Two-Week Low Ahead of Fed Minutes

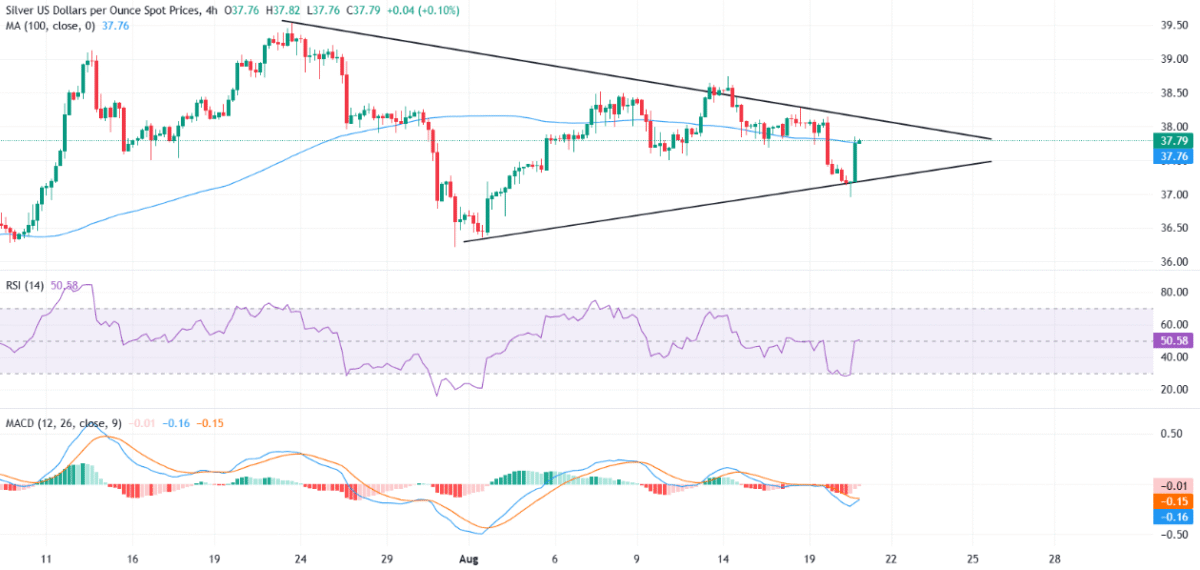
    Silver (XAG/USD) rebounds from a two-week low as the US Dollar weakens and traders await the Fed’s July meeting minutes. Will XAG/USD break higher from its symmetrical triangle pattern?


    Silver Price Rebound Amid Dollar Weakness

    Silver (XAG/USD) staged a sharp recovery on Wednesday, snapping a four-day losing streak after dropping to its lowest level since August 4. The metal found support as the US Dollar retreated, pressured by political headlines after President Trump called for the resignation of Federal Reserve Governor Lisa Cook.

    At the time of writing, XAG/USD trades around $37.80, up nearly 1% on the day, after rebounding from an intraday low of $36.96. The move comes as markets turn cautious ahead of the release of the FOMC July meeting minutes at 18:00 GMT, which may shape expectations for the Fed’s inflation outlook and rate trajectory.


    Silver Technical Analysis: Triangle Pattern in Play

    On the 4-hour chart, Silver is trading within a symmetrical triangle formation, consolidating recent price action. The rebound from the lower boundary near $37.00 suggests strong buying interest at this support zone.

    • Immediate resistance sits at the 100-period Simple Moving Average (SMA) near $37.76.
    • A sustained breakout above this level could open the door toward $38.20, the upper boundary of the triangle and a key psychological mark.
    • Further upside targets include $38.74 (August 14 swing high) and $39.53, a multi-year peak.

    On the downside:

    • A failure to clear the 100-SMA may keep Silver confined within the triangle.
    • A break below $37.00 support could trigger bearish momentum, exposing $36.50 and $35.90 as the next demand levels.

    Momentum Indicators Signal Potential Shift

    • RSI: After briefly dipping into oversold territory, the Relative Strength Index has rebounded toward the midline, signaling improving intraday strength.
    • MACD: The histogram is narrowing, with the MACD line nearing a bullish crossover above the signal line—an early sign that bearish pressure is fading.

    These technical signals suggest a potential bullish reversal is underway if Silver can secure a breakout above resistance.


    Silver Price Forecast: Outlook

    Silver’s near-term outlook hinges on the Fed’s July meeting minutes and the US Dollar’s reaction. A dovish tilt in the Fed’s inflation or rate outlook could weaken the Dollar further, providing support for Silver prices. Conversely, a hawkish tone may cap gains and keep XAG/USD trapped within its current range.

    In summary:

    • Above $38.20 → bullish momentum may accelerate toward $38.74 and $39.53.
    • Below $37.00 → sellers could regain control, targeting $36.50 and $35.90.

      First Name (required)

      Last Name (required)

      Preferred Method of Contact (required)

      eMailPhoneSkypeWhatsApp/Viber/Telegram,etc.


      Your Email (required)

      Your Phone (required)

      Your Mobile

      Your Skype

      Your Message (required)

      I am interested in (tick all that apply):

      GDPR Agreement*
      See our privacy policy to learn more about how we use data.

      UK Inflation Jumps to 3.8% in July 2025, Highest in Over a Year

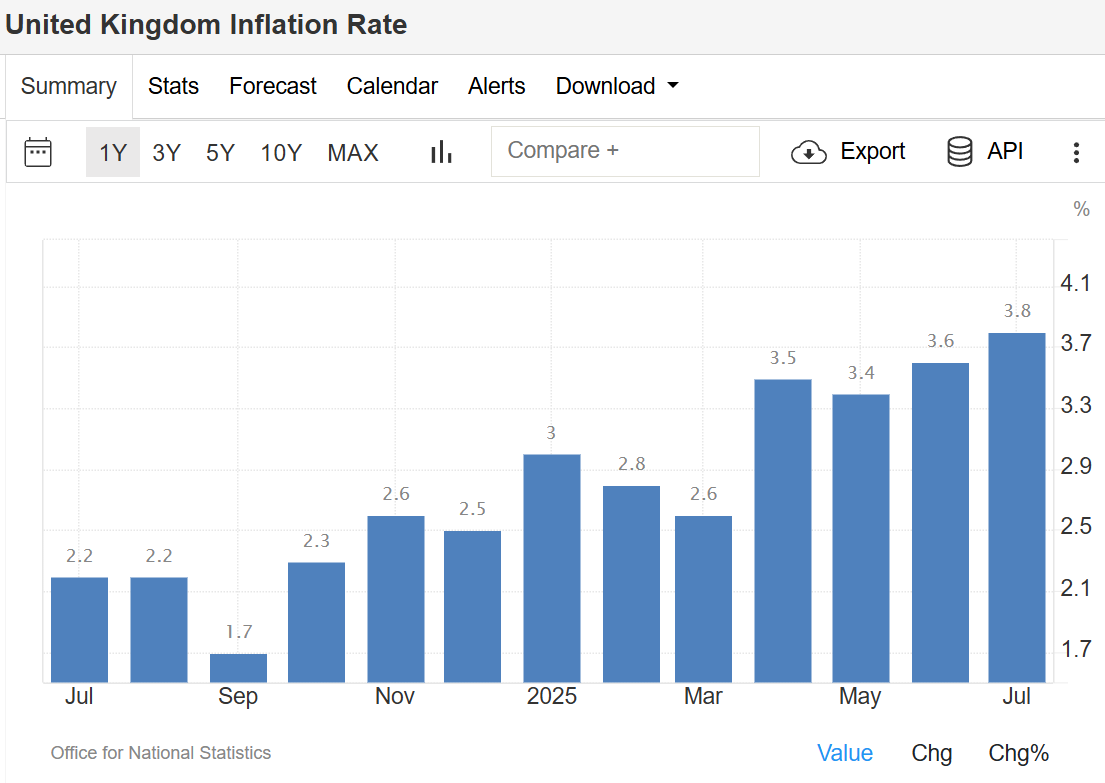
      The UK inflation rate rose to 3.8% in July 2025, marking its highest level since January 2024. This was up from 3.6% in June and slightly above market forecasts of 3.7%, according to the Office for National Statistics (ONS).

      The main driver of the increase came from the transport sector, where prices climbed 3.2% compared to 1.7% in June. Airfares surged by a sharp 30.2%, largely influenced by the timing of the school summer holidays. Higher motor fuel costs, sea fares, and roadside recovery services also pushed transport inflation higher.

      Other notable contributors included restaurants and hotels, where prices rose 3.4% versus 2.6% in June, largely due to more expensive overnight hotel stays. Food and non-alcoholic beverages also accelerated, rising 4.9% compared to 4.5% the previous month.

      On the other hand, housing and household services eased slightly, providing some relief. Inflation in this category dropped to 6.2% from 6.7%, reflecting softer growth in owner-occupiers’ housing costs and rents.

      On a monthly basis, the Consumer Price Index (CPI) increased 0.1% in July, defying expectations of a 0.1% decline. However, this was slower than June’s 0.3% rise. Core inflation, which excludes energy, food, alcohol, and tobacco, also edged up to 3.8% from 3.7%. source: Office for National Statistics

      Contact us if you have any questions or want a Free Consultation.

        First Name (required)

        Last Name (required)

        Your Email (required)

        Preferred Method of Contact (required)
        eMailPhoneSkypeWhatsApp/Viber/Telegram,etc.

        Your Phone (required)

        Your Mobile

        Your Skype

        Category (required)

        Subject (required)

        Your Message (required)

        I am interested in (tick all that apply):

        GDPR Agreement*
        See our privacy policy to learn more about how we use data.

        United States Stock Market Index & Housing Market Update – August 2025

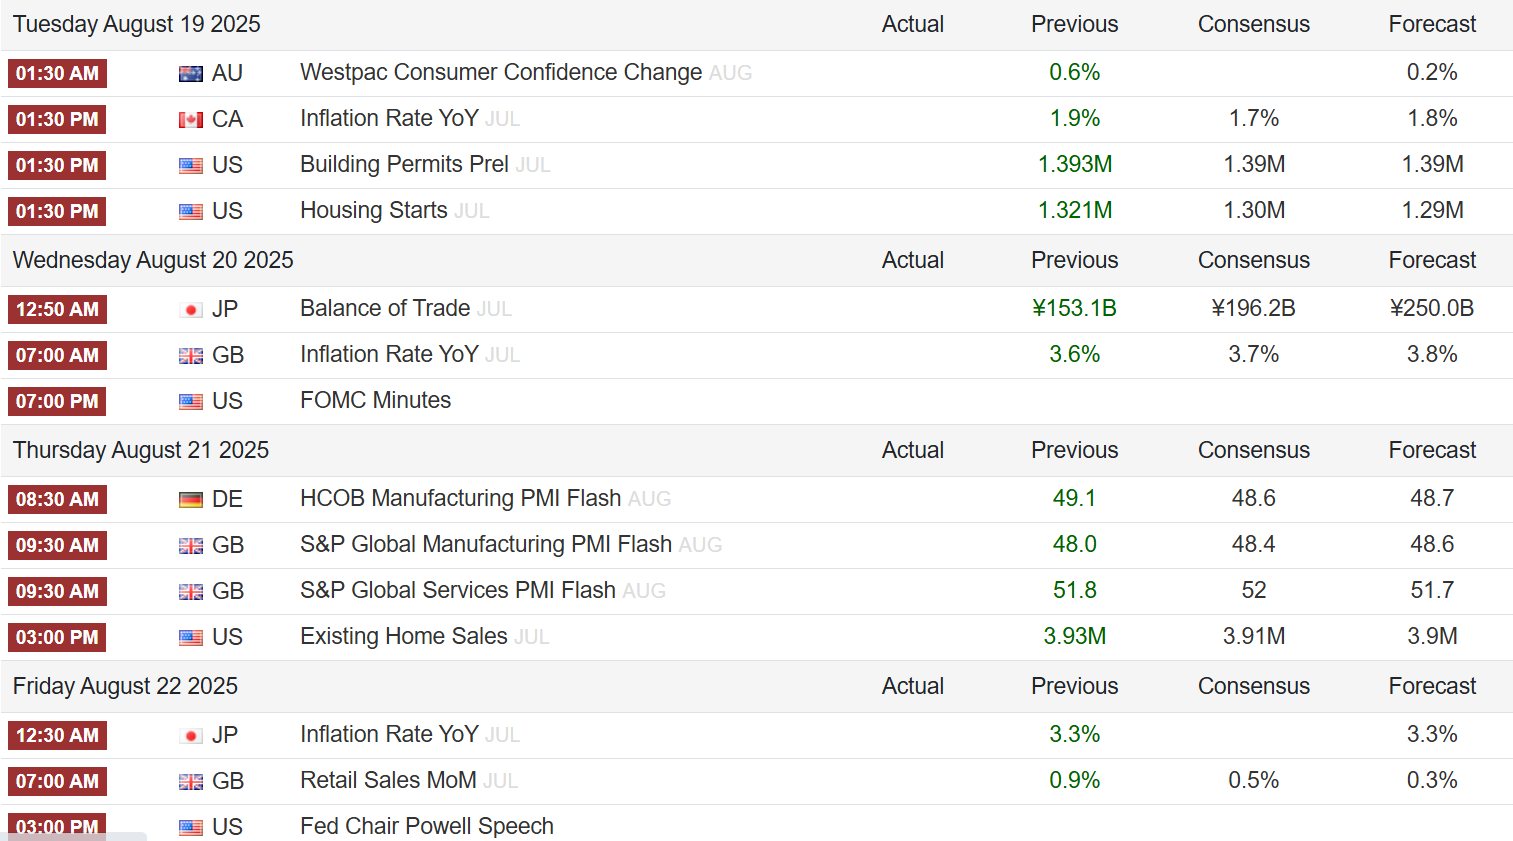
        Economic Calendar Major Upcoming Events

        Stock Market Overview

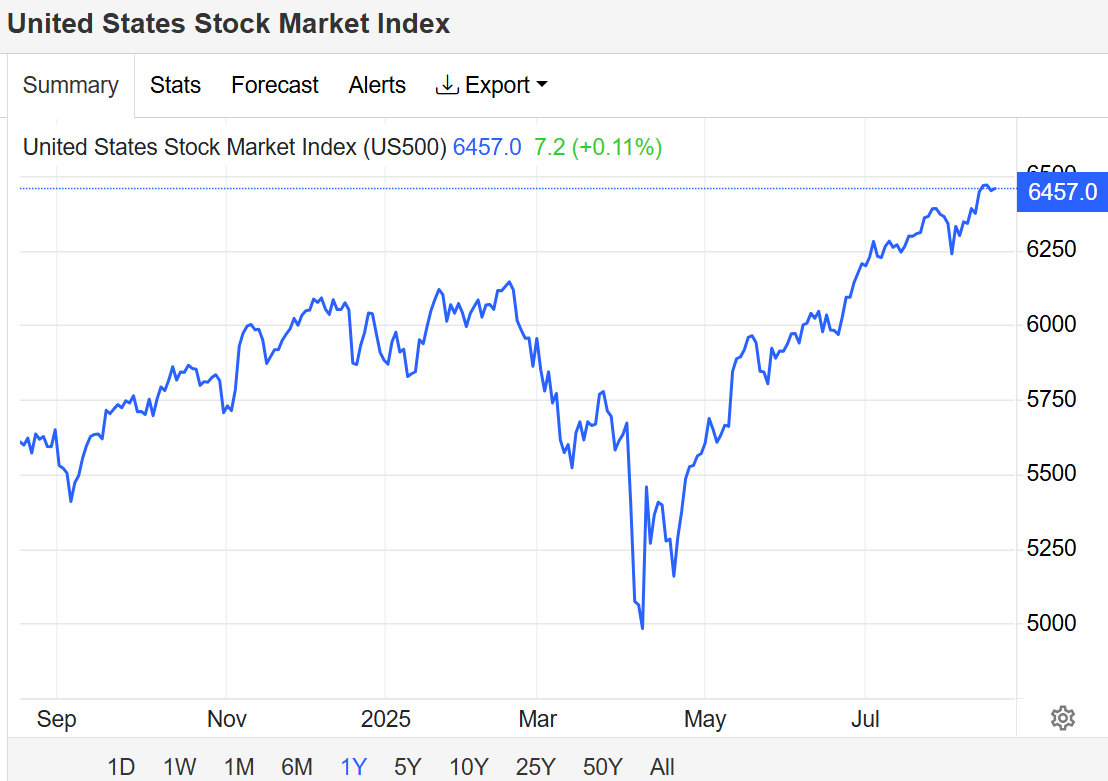
        US stocks saw limited movements on Monday, with major indexes holding near their record highs from last week. The S&P 500, Nasdaq 100, and Dow Jones Industrial Average all traded flat as investors awaited fresh catalysts, particularly from:

        • The Federal Reserve’s FOMC meeting minutes
        • The Jackson Hole Symposium later this week

        Both are expected to offer hints on the Fed’s interest rate outlook.

        Trade these data points with Swap Hunter by your side and you are going to have an edge on your Broker, your Bank and your Colleagues.

        Download the Swap Hunter Trading System HERE.

        Check out our Prices here.

        Equities remain supported by growing bets on multiple rate cuts this year, as markets respond to signs of a softening labor market and disinflation pressures.

        Key Market Highlights:

        • Chipmakers and AI-exposed stocks climbed, with Nvidia (+0.5%) staying near record highs despite recent US export controls.
        • Retail stocks were mixed ahead of upcoming quarterly earnings reports.
        • Geopolitical backdrop: EU leaders prepared to meet Ukraine’s President Zelensky following US President Trump’s summit with Russian President Putin.

        NAHB Housing Market Index – August 2025

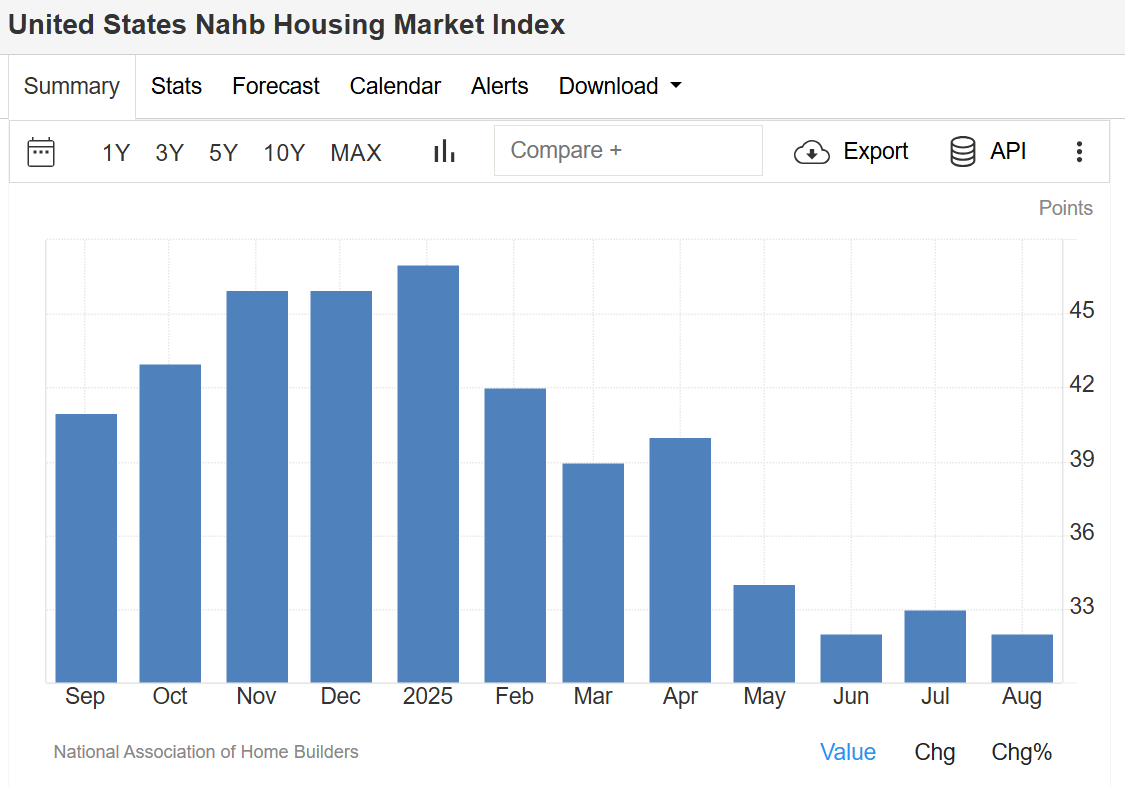
        The NAHB/Wells Fargo Housing Market Index (HMI) slipped to 32 in August 2025, down from 33 in July and below expectations of 34, signaling persistent challenges in the housing sector.

        Breakdown of Housing Data:

        • Current sales conditions: fell one point to 35
        • Sales expectations (next 6 months): steady at 43
        • Buyer traffic: rose two points to 22, still at historically low levels

        Builder Incentives & Pricing Trends:

        • 37% of builders cut prices in August (down from 38% in July)
        • Average price reduction remained at 5% for the tenth straight month
        • 66% of builders used sales incentives, the highest post-Covid level, up from 62% in July

        This data reflects ongoing affordability concerns, limited buyer demand, and sustained reliance on incentives to stimulate sales. source: National Association of Home Builders


        Outlook

        • Stock Market: Investors remain cautious but optimistic, balancing AI-driven growth and monetary policy expectations.
        • Housing Market: Persistent weakness in builder confidence highlights the impact of affordability challenges, even as incentives expand.

        📊 Both markets remain heavily influenced by Federal Reserve policy signals, making this week’s Jackson Hole Symposium a pivotal event for investors and analysts.

        Frequently Asked Questions (FAQ)

        1. What is the current United States Stock Market Index level in August 2025?

        In August 2025, the S&P 500, Nasdaq 100, and Dow Jones remain near record highs after a strong rally earlier in the month. Markets are currently trading flat as investors await signals from the Federal Reserve’s policy outlook.

        2. Why are US stocks trading flat despite strong AI and chipmaker performance?

        While AI-related stocks like Nvidia continue to perform strongly, overall market movement is subdued due to uncertainty over the Federal Reserve’s interest rate decisions. Investors are waiting for clarity from the Jackson Hole Symposium and FOMC meeting minutes.

        3. What does the NAHB Housing Market Index measure?

        The NAHB/Wells Fargo Housing Market Index (HMI) measures builder confidence in the housing market, covering current sales, buyer traffic, and future sales expectations. A reading above 50 indicates optimism, while below 50 reflects weakness.

        4. Why did the NAHB Housing Market Index fall in August 2025?

        The index fell to 32 in August 2025 due to weak buyer demand, affordability challenges, and higher reliance on sales incentives and price cuts by builders.

        5. Are US home builders offering more incentives in 2025?

        Yes. In August 2025, 66% of builders reported using sales incentives, the highest since the post-Covid period. Price cuts remain common, with an average reduction of 5% per home.

        Technical Analysis: S&P 500 – August 2025

        The S&P 500 continues to hover near record highs after its sharp rally this summer. Momentum remains strong, but the index is showing signs of consolidation as traders await policy signals from the Federal Reserve.

        Key Technical Levels

        • Resistance Zone: 5,650 – 5,700 → The index is struggling to break above this level, marking a potential short-term ceiling.
        • Support Levels:
          • 5,500 (near-term support) – A break below could invite short-term selling.
          • 5,350 (major support) – A key level to watch, aligning with the 50-day moving average (50-DMA).

        Moving Averages

        • 50-Day Moving Average (50-DMA): ~5,350 – Currently acting as strong dynamic support.
        • 200-Day Moving Average (200-DMA): ~4,950 – Well below current levels, confirming a longer-term bullish trend.

        Momentum Indicators

        • RSI (Relative Strength Index): Hovering around 64, just below the overbought threshold (70). This suggests the index is consolidating but not yet in danger of a deep correction.
        • MACD (Moving Average Convergence Divergence): Still in positive territory, though momentum is flattening, pointing to a possible range-bound movement in the short term.

        Chart Outlook

        The S&P 500 remains bullish in the medium to long term, supported by AI-driven growth and easing inflation expectations. However, short-term consolidation is likely until traders get more clarity from Fed policy announcements.

        Trading Strategy (Not Financial Advice):

        • Bullish bias above 5,500 support
        • Watch for a breakout above 5,700 for continuation toward new record highs
        • Caution: A sustained break below 5,350 could trigger deeper pullbacks

        This is our recommended Broker to Work with although you can use Swap Hunter with any MT4 Financial Derivatives Broker

        Open your Trading Account Here to Start Capitalizing on the Financial Markets with Swap Hunter.
        To Open your Trading Account Click Here

          First Name (required)

          Last Name (required)

          Your Email (required)

          Preferred Method of Contact (required)
          eMailPhoneSkypeWhatsApp/Viber/Telegram,etc.

          Your Phone (required)

          Your Mobile

          Your Skype

          Category (required)

          Subject (required)

          Your Message (required)

          I am interested in (tick all that apply):

          GDPR Agreement*
          See our privacy policy to learn more about how we use data.

          Trump Mocks Goldman Sachs CEO David Solomon: “Maybe He Ought to Just Focus on Being a DJ”

          Former President Donald Trump took aim at Goldman Sachs CEO David Solomon on Tuesday, poking fun at his side gig as a DJ while blasting the bank’s past economic forecasts.

          “David Solomon and Goldman Sachs refuse to give credit where credit is due,” Trump wrote on Truth Social. “They made a bad prediction a long time ago on both the Market repercussion and the Tariffs themselves, and they were wrong, just like they are wrong about so much else.”

          Inflation Numbers Trigger Trump’s Remarks

          Trump’s comments followed the release of the July Consumer Price Index (CPI) report — a key measure of inflation. The Bureau of Labor Statistics reported year-over-year inflation at 2.7%, slightly below analyst forecasts of 2.8%.

          The Federal Reserve, led by Chair Jerome Powell, has maintained interest rates while evaluating the inflationary impact of tariffs.

          Trump took the latest CPI data as validation of his economic stance:

          “It has been proven, that even at this late stage, Tariffs have not caused Inflation, or any other problems for America, other than massive amounts of CASH pouring into our Treasury’s coffers,” he said.

          Solomon Joins Growing List of CEO Targets

          Solomon is the latest high-profile executive in Trump’s firing line. Just last week, the former president called for Intel CEO Lip-Bu Tan’s resignation — before reversing course after meeting with him at the White House on Monday.

          With this latest jab, Trump continues his pattern of publicly challenging corporate leaders, often blending policy criticism with personal ridicule.

            First Name (required)

            Last Name (required)

            Your Email (required)

            Preferred Method of Contact (required)
            eMailPhoneSkypeWhatsApp/Viber/Telegram,etc.

            Your Phone (required)

            Your Mobile

            Your Skype

            Category (required)

            Subject (required)

            Your Message (required)

            I am interested in (tick all that apply):

            GDPR Agreement*
            See our privacy policy to learn more about how we use data.

            Buffett Indicator Hits Record High of 208% — Is a Stock Market Crash Coming?

            Key Points


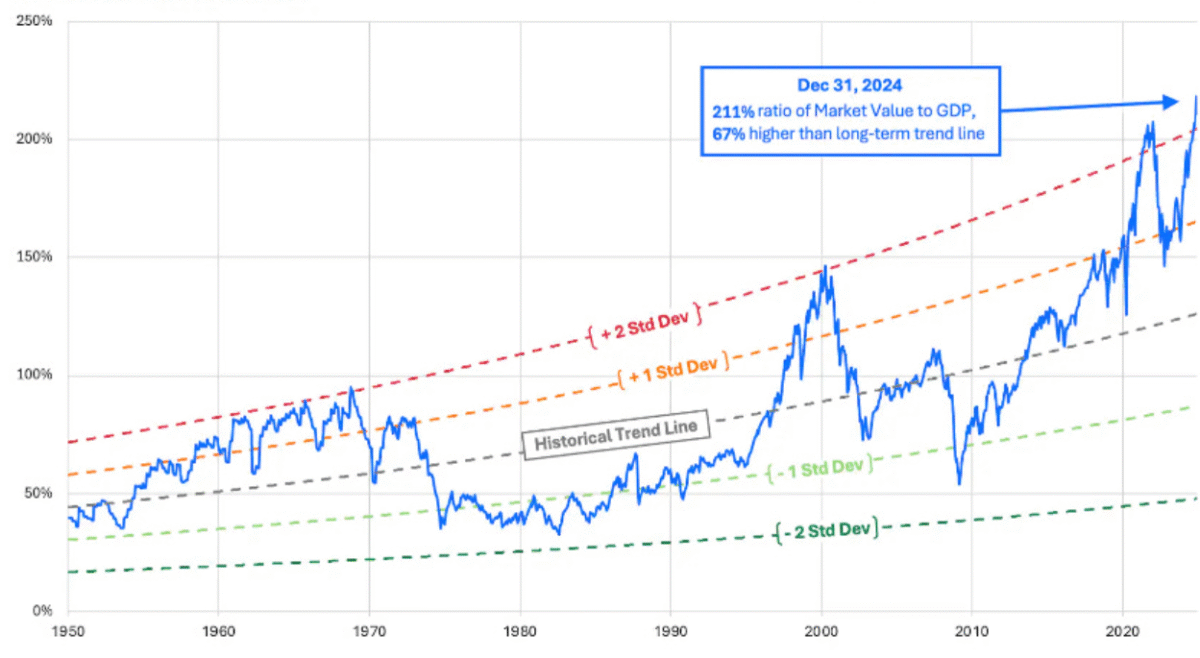
            • A market valuation metric popularized by Warren Buffett is at an all-time high of roughly 208%.
            • Buffett has said that anytime this indicator approaches 200%, investors are “playing with fire.”
            • History has proven Buffett right in the past.

            Even after Warren Buffett steps down as CEO of Berkshire Hathaway (NYSE: BRK.A) (NYSE: BRK.B), his legacy will live on. So will an indicator that bears his name.


            Buffett told Fortune magazine in 2001 that this metric, now known as the Buffett indicator, is “probably the best single measure of where valuations stand at any given moment.” And now the Buffett indicator is at the highest level ever, sending a warning.

            What is the Buffett indicator?


            The Buffett Indicator measures the ratio of the total U.S. stock market capitalization to U.S. Gross Domestic Product (GDP).

            • Low Readings (70–80%) → Historically great buying opportunities.
            • High Readings (200%+) → Elevated risk of overvaluation.

            Originally, Buffett used Gross National Product (GNP), but GDP is now more commonly applied in the calculation.

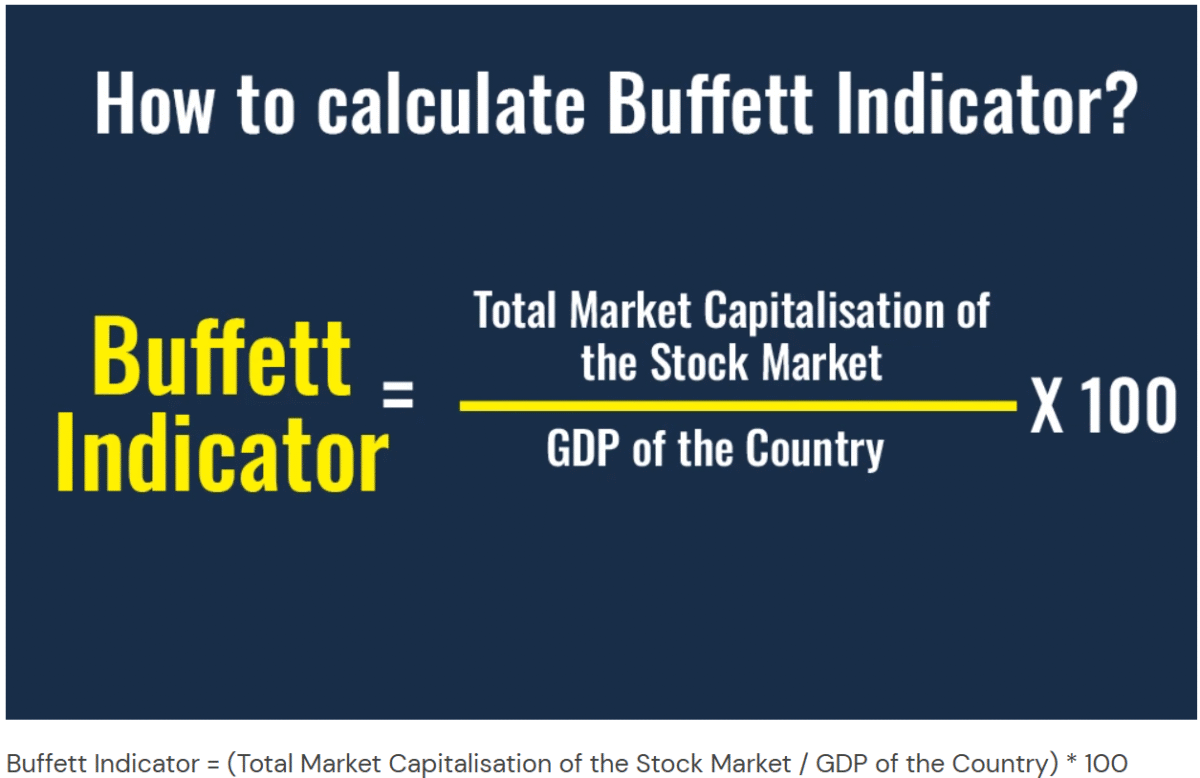
            The Buffett Indicator, also known as the Market Cap to GDP Ratio, is a valuation metric used to assess whether the stock market is overvalued or undervalued relative to the economy. It is calculated by dividing the total market capitalization of a country’s stock market by its gross domestic product (GDP). 

            Here’s the formula:

            Buffett Indicator (%) = (Total Stock Market Capitalization ÷ Gross Domestic Product (GDP)) × 100 

            In a sense, the Buffett indicator is similar to the most widely used stock valuation metric — the price-to-earnings ratio. Instead of the share price of a single stock, the total market cap of all U.S. stocks is used. Instead of the earnings generated by a single company, the metric uses the total value generated by everyone in the U.S.

            With the Buffett indicator and the price-to-earnings ratio, a lower number reflects a more attractive valuation. Buffett hinted at an ideal range for his namesake metric in the 2001 Fortune article, saying, “If the percentage relationship falls to the 70% or 80% area, buying stocks is likely to work very well for you.”

            Here are various images of the Buffet Indicator demonstrating it’s accuracy to predict price action.

            Buffet Indicator current levels.

            History lesson


            As you might have guessed, the Buffett indicator isn’t anywhere close to the 70% to 80% range right now. It’s slightly over 208%, the highest level the indicator has ever reached!
            If you want to know why Buffett isn’t buying many stocks these days, the Buffett indicator probably explains it.

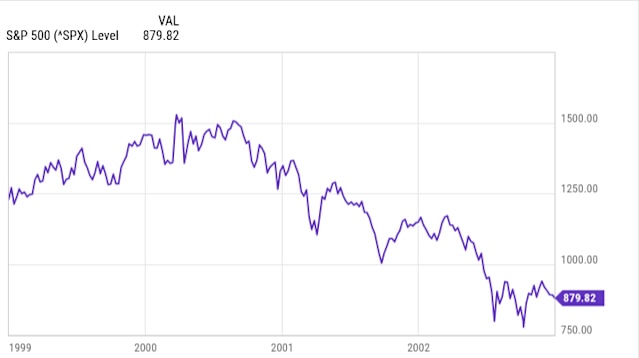
            Buffett’s concern about a high market valuation as measured by the Buffett indicator has been justified by history. He mentioned the indicator spiking in 1999 and 2000, reaching what was then an all-time high. Many investors remember what happened soon afterward. The dot-com bubble burst, with the S&P 500(SNPINDEX: ^GSPC) plunging nearly 50% below its previous peak by late 2002.

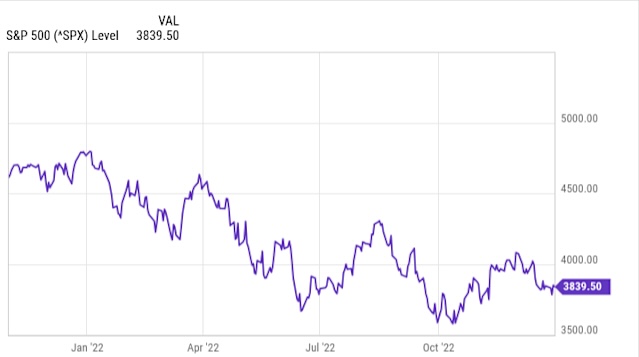
            The Buffett indicator again came close to hitting 200% in November 2021. Within a matter of weeks, the S&P 500 began to sink and eventually fell as much as 25%.

            Will the stock market crash again soon?


            These historical precedents aren’t encouraging for investors. However, the Buffett indicator isn’t great at predicting short-term stock market moves. For example, the indicator has been above its level in early 2000 (right before the dot-com bubble burst) for most of the period since 2018. During this time, the S&P 500 has soared more than 130%, albeit with significant volatility.
            However, there’s no getting around the fact that U.S. stocks are historically expensive.

            The Buffett indicator isn’t the only metric that reflects this.

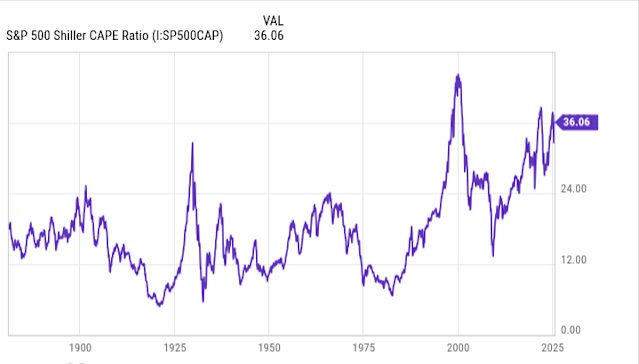
            The S&P 500 Shiller CAPE ratio, popularized by Yale economics professor Robert Shiller, is near its third-highest level ever.

            Stock valuations don’t tend to remain above historic levels for too long. Sooner or later, they will return to a more normal range. With the Buffett indicator at an all-time high, investors probably should brace themselves for what the stock market might do over the near term and almost certainly will do eventually – revert to the mean average, meaning huge declines across all global stock market Indices.

            What Should Investors Do Now?

            Stay disciplined – focus on long-term investment strategies rather than short-term market timing.

            Our Strategies at Swap Hunter offer exactly this click here to check them out on our website.

            Don’t panic, but be cautious – high valuations increase risk. So it is time to start hedging, find correlated assets and create multiple hedges to balance your portfolio to preserve equity, minimize risk exposure, generate swaps, and create potential to make money on the downside and eventually the upside once the correction is over and markets start recovering.

            Diversify your portfolio – to manage volatility. Many stock pickers/investors are moving into Forex, Cryptocurrency ETF’s, Commodities and other Asset Classes.

            Cryptocurrencies– Bitcoin, Ethereum, Ripple and Litecoin have had a lot of coverage recently for multiple reasons. Spot Crypto ETF’s and Stable Coins like USDC are gaining a lot traction and attracting many institutional level investors and the Banks with new legislation being passed post the latest U.S. election. We are happy to go into more detail with you in a private consultation.

            Canary Capital CEO Steven McClurg sits down with CNBC Crypto World to discuss spot crypto ETFs and regulatory advancements for digital assets in the United States.

            Bitcoin could reach $150,000 before facing a bear market: Canary Capital CEO Steven McClurg.

Canary Capital CEO Steven McClurg sits down with CNBC Crypto World to discuss spot crypto ETFs and regulatory advancements for digital assets in the United States.

            Other Asset Classes to consider – Renewable Energies, Water, Data Mining, Rare Earth Metals, AI individual stocks and ETF’s are all places you want some exposure.

            Indices – we have started taking short positions on the DOW, NASDAQ, S&P500, DAX30 and NIKKEI. Most of these are also offering a positive swap right now.

            What Strategy Should investors use?

            Strategy is everything. Our Carry Trade strategies at Swap Hunter offer risk minimization, equity preservation and slow and steady wealth generation. we always hear feedback from our clients how our system is low stress and requires little need for them to be glued to their screens all day and night using technical analysis, watching for data releases and news headlines that cause big movements on the markets and will affect their trades.

            In trading, a carry trade means earning the difference between the interest rates of two currencies (the swap).

            A carry trading indicator like Swap Hunter would help traders spot profitable carry opportunities — ideally before the market prices them in — by tracking interest rate differentials, central bank moves, volatility, and funding costs.

            Find the Carry Trades Everyone Else Misses.

            Most traders think they know their swap rates — until they wake up and find overnight funding costs quietly drained their profit.

            The real edge in carry trading isn’t what your broker publishes — it’s the hidden shifts in funding costs, central bank signals, and liquidity squeezes that flip your positive carry negative before the market prices it in.

            That’s the Black Swan that catches everyone — except the ones hunting it.


            Before you buy stock in S&P 500 Index, consider:

            Swap Hunter just identified what they believe are the best assets and trades for investors to buy now. The 10 trades that made the cut could produce monster returns in the coming years.

            Create a stable, well balanced and diversified portfolio with our Swap Hunter software and Strategies

            Open your Trading Account with Multibank Group to get 10 Free Training Sessions

            Register with Swap Hunter to receive all Benefits mentioned on our Site
              First Name (required)

              Last Name (required)

              Your Email (required)

              GDPR Agreement*
              See our privacy policy to learn more about how we use data.

              🌍 FX Market Update – August 6, 2025

              Open your Trading Account Here to Start Investing on the Financial Markets with MultiBank Group.

              Australian Dollar Leads Gains, Asian Currencies Slip

              The foreign exchange market saw notable movement today, with the Australian Dollar (AUD) emerging as the top gainer, while several Asian currencies faced pressure. Here’s a breakdown of the latest action:


              🔼 Top Currency Gainers

              🇦🇺 Australian Dollar (AUD) – +0.30%

              The AUD surged on the back of robust trade data and stronger commodity prices, outpacing its peers in today’s session.

              💵 Dollar Index (DXY) – +0.02%

              The U.S. Dollar index posted a modest gain as traders remain cautious ahead of upcoming U.S. labor market reports later this week.


              🔽 Top Currency Losers

              🇰🇷 South Korean Won (KRW) – -0.26%

              The KRW dropped the most among major currencies due to export concerns and regional geopolitical uncertainty.

              🇯🇵 Japanese Yen (JPY) – -0.18%

              The JPY weakened as the Bank of Japan stays committed to its ultra-loose monetary stance.

              🇬🇧 British Pound (GBP) – -0.10%

              The GBP slipped after soft inflation data led traders to price in a more dovish outlook from the Bank of England.

              🇪🇺 Euro (EUR) – -0.03%

              The Euro edged slightly lower amid mixed eurozone data and cautious signals from the European Central Bank (ECB).


              📊 FX Performance Summary

              CurrencyChange (%)Movement
              🇦🇺 AUD+0.30%Strong Gain
              💵 DXY+0.02%Mild Upside
              🇪🇺 EUR-0.03%Slight Decline
              🇬🇧 GBP-0.10%Weakening
              🇯🇵 JPY-0.18%Under Pressure
              🇰🇷 KRW-0.26%Sharp Decline

              💬 Market Outlook

              With commodity markets holding firm and economic data rolling in, traders will continue watching central bank policy cues and geopolitical developments. The AUD’s strength may persist if risk sentiment remains positive, while Asian currencies may stay under pressure without regional economic improvement.


              📝 Stay Updated

              Join our Telegram Channel or on WhatsApp for real-time market insights, chart analysis, and strategy tips.

              You can also register your details in this form to stay updated with our Trading Activities and strategies.

                First Name (required)

                Last Name (required)

                Your Email (required)

                Preferred Method of Contact (required)
                eMailPhoneSkypeWhatsApp/Viber/Telegram,etc.

                Your Phone (required)

                Your Mobile

                Your Skype

                Category (required)

                Subject (required)

                Your Message (required)

                I am interested in (tick all that apply):

                GDPR Agreement*
                See our privacy policy to learn more about how we use data.

                Open an Account with our Recommended Broker and get ongoing training and support using Swap Hunter, Market analysis, Strategy assistance and coaching or a fully Managed Account through Copy Trading or PAMM Solutions. Just click on image below and register your Trading account today.

                Open Your Trading Account Here
                Click on Image to Register with Top Broker in the Industry

                UK Retail Sales Edge Up But Challenges Persist

                Open your Trading Account Here to Start Investing on the Financial Markets with MultiBank Group.

                Excerpt:
                The CBI’s retail sales index rose slightly in July 2025 but stayed weaker than expected, showing UK retailers are still battling tough economic conditions. Meanwhile, Hong Kong’s import growth slowed in June as demand shifted across sectors and trading partners.


                📉 UK Retail Sales: Modest Improvement in July

                The Confederation of British Industry’s (CBI) latest monthly retail sales gauge brought a hint of relief for UK retailers. The index climbed to -34 in July, improving from June’s 17-month low of -46. However, this figure still missed analysts’ expectations of -26, underlining how high prices and ongoing economic uncertainty continue to drag on consumer spending.

                Retail sales volumes have now fallen for ten consecutive months, reflecting the squeeze on household budgets. Looking ahead, retailers are slightly more optimistic about August, with the measure of expected sales rising to -31, compared to -49 a month earlier.


                🌏 Hong Kong Imports: Growth Cools in June

                Hong Kong’s imports climbed 11.1% year-on-year to $476.7 billion in June 2025, according to the Census and Statistics Department. While this marks another month of growth, it was the slowest rate in five months, down from May’s sharp 18.9% rise.

                Imports surged from Vietnam (+50.6%), the United Kingdom (+44.7%), mainland China (+17.3%), Thailand (+15.9%) and the United States (+3.9%). However, imports from South Korea saw a sharp decline (-27.1%).

                By product category, there were broad gains in key sectors:

                • Electrical machinery, apparatus and parts rose 14.6% (vs 23.7% in May)
                • Telecommunications equipment increased 17.7%
                • Office machines and data processing equipment rose 9.8%
                • Miscellaneous manufactured articles grew 12.6%
                • Power-generating machinery jumped 38.7%

                In contrast, declines were recorded for non-metallic mineral manufactures (-15.6%), professional and scientific instruments (-9.4%) and petroleum-related products (-10.5%).


                📌 Sources

                  First Name (required)

                  Last Name (required)

                  Preferred Method of Contact (required)

                  eMailPhoneSkypeWhatsApp/Viber/Telegram,etc.


                  Your Email (required)

                  Your Phone (required)

                  Your Mobile

                  Your Skype

                  Your Message (required)

                  I am interested in (tick all that apply):

                  GDPR Agreement*
                  See our privacy policy to learn more about how we use data.

                  open an Account with MEX Atlantic part of MultiBank Group
                  Open your Trading Account with MEX Atlantic MultiBank Group Here

                  U.S. Mortgage Applications Surge, Markets Rally Amid Trade Developments, and Mexico Inflation Softens

                  Mortgage Applications See Strongest Weekly Rise in a Month

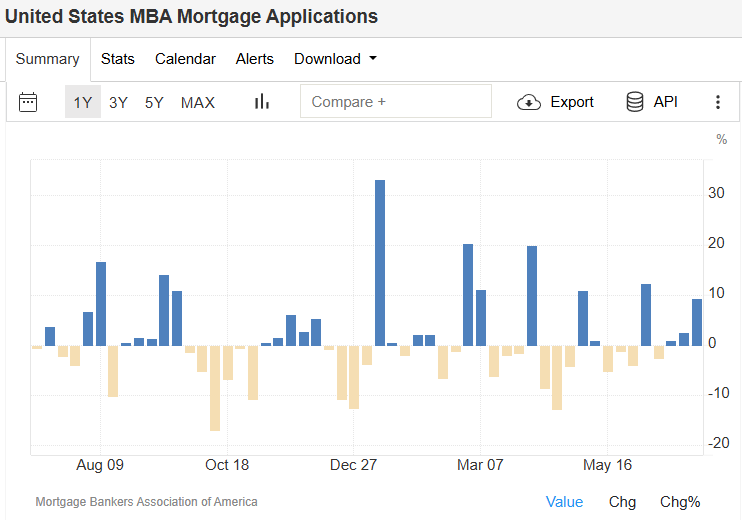
                  In the first week of July 2025, the volume of U.S. mortgage applications soared by 9.4% from the previous week — the largest increase in a month, according to data from the Mortgage Bankers Association. This marks the third consecutive weekly gain, the longest streak since December 2024, as benchmark mortgage rates dipped to their lowest since April.

                  Refinancing activity, which tends to respond quickly to changes in short-term rates, jumped 9% week-over-week and surged 56% compared to the same period in 2024. Similarly, purchase applications rose 9% on the week and were up 25% year-over-year, highlighting renewed strength in the housing market. source: Mortgage Bankers Association of America


                  Markets Edge Higher on Trade Announcements and Fed Speculation

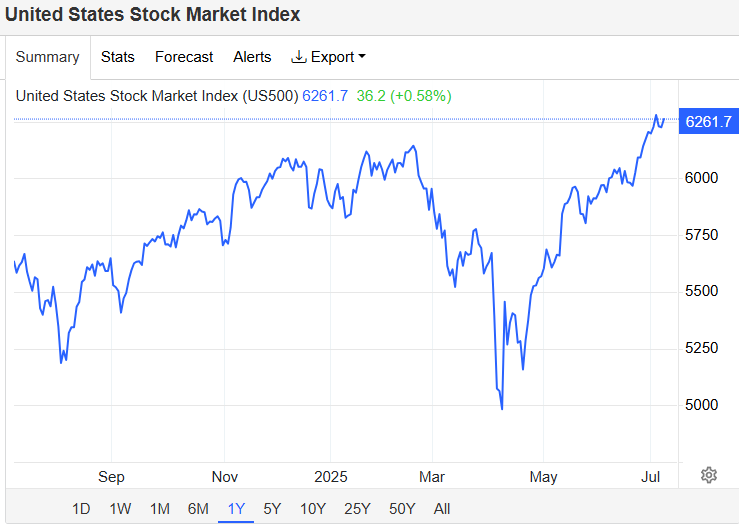
                  U.S. equities closed higher on Wednesday as traders digested updates on trade policy and awaited the Federal Reserve’s next moves. The S&P 500 gained 0.5%, the Nasdaq climbed 0.7%, and the Dow Jones rose by nearly 200 points.

                  President Trump signaled that major trade announcements would be made, including a planned 50% tariff on copper imports and potential 200% tariffs on pharmaceuticals, though implementation is delayed by 12–18 months to give industries time to adapt.

                  Market participants are closely watching for the FOMC minutes release, which may offer insights into the timing of potential interest rate cuts. Expectations remain strong for two 25 basis point cuts before year-end.

                  Technology stocks led gains, with Nvidia up 2.2% and Microsoft rising 1.2%. Apple shares were flat, following a statement by White House Trade Counselor Peter Navarro suggesting the company considers itself “too big to tariff.”


                  Mexico’s Inflation Slows but Core Pressures Rise

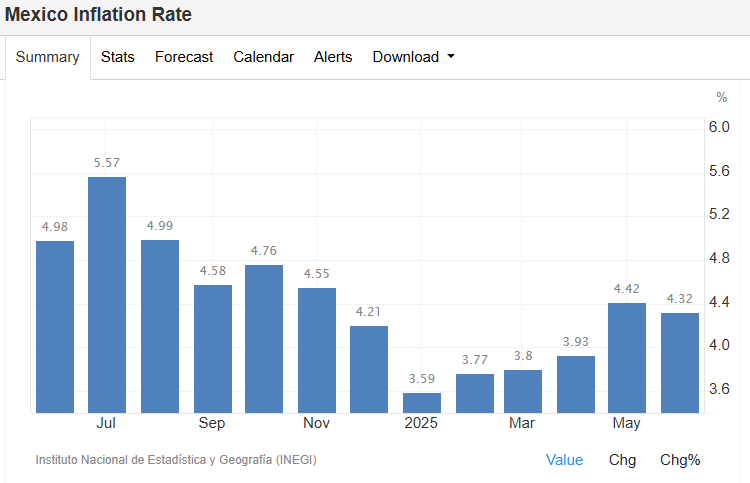
                  Mexico’s annual inflation rate eased to 4.32% in June 2025, down slightly from 4.42% in May, aligning closely with market expectations of 4.31%, according to the national statistics agency INEGI.

                  Price growth moderated in agriculture (5.04% vs 6.76%) and energy (3.56% vs 3.93%), while accelerating for goods, food, beverages, and services. Notably, core inflation ticked up to 4.24%, suggesting that underlying price pressures remain sticky.

                  On a monthly basis, inflation was unchanged at 0.28%, maintaining the same pace as in May.  Instituto Nacional de Estadística y Geografía (INEGI)


                  Conclusion

                  With falling mortgage rates energizing the U.S. housing market, equity markets buoyed by trade policy hints, and inflation trends in Mexico showing mixed signals, July 2025 is shaping up to be a pivotal month for both investors and policymakers.

                  Stay tuned for more updates on monetary policy, inflation data, and global economic trends.

                    First Name (required)

                    Last Name (required)

                    Your Email (required)

                    Preferred Method of Contact (required)
                    eMailPhoneSkypeWhatsApp/Viber/Telegram,etc.

                    Your Phone (required)

                    Your Mobile

                    Your Skype

                    Category (required)

                    Subject (required)

                    Your Message (required)

                    I am interested in (tick all that apply):

                    GDPR Agreement*
                    See our privacy policy to learn more about how we use data.

                    Open Your MultiBank Trading Account Here

                    📉 DE40 Slips as Inflation Cools and Retail Sales Drop: Germany Stock Market Outlook

                    📊 Germany Stock Market Index (DE40) Falls Amid Economic Uncertainty

                    The Germany Stock Market Index (DE40)—which tracks the performance of 40 top German blue-chip stocks—closed down 0.5% at 23,910 on Monday, breaking a two-day winning streak. The decline comes amid mixed domestic economic data and renewed trade concerns.


                    🇩🇪 Key Economic Indicators in Germany

                    ✅ Inflation Cools in June

                    German inflation surprised markets by dropping to 2.0% year-on-year in June, down from 2.1% in May and below the 2.2% forecast. This signals easing price pressure, potentially giving the European Central Bank (ECB) more flexibility on interest rates.

                    ❌ Retail Sales Point to Weak Consumer Demand

                    Germany’s retail sales fell 1.6% in May, following a 0.6% drop in April. This back-to-back decline underlines sluggish domestic consumption, a key factor limiting broader economic recovery in Europe’s largest economy.


                    🌐 Trade Tensions Add Market Pressure

                    Global trade uncertainty continues to weigh on the German stock market. U.S. President Trump confirmed that trade negotiations are ongoing but won’t extend the current 90-day tariff pause beyond July 9. This raises risks for Germany’s export-heavy economy, especially sectors like automotive and chemicals.


                    🔻 Biggest DAX Losers: Symrise and Bayer

                    • Symrise AG led the market declines with a sharp 7% drop, likely due to sector sentiment or earnings-related concerns.
                    • Bayer AG tumbled 5.4% after the U.S. Supreme Court requested the government’s opinion on Monsanto weedkiller litigation, reigniting legal uncertainty for the pharma and agrochemical giant.

                    📆 DE40 Monthly Performance

                    Despite occasional gains, the DAX (DE40) ended June with a modest 0.4% loss, reflecting ongoing macroeconomic headwinds and market caution.


                    📌 What to Watch Next

                    • July 9 Trade Deadline: Markets will closely monitor whether new tariffs are imposed.
                    • Upcoming ECB Decisions: Slower inflation may influence monetary policy.
                    • Consumer Confidence & Earnings Reports: Key indicators for Q3 market direction.
                    Line chart of DE40 index performance (June 2024 2025)
                    EU Stock Indexes

                      First Name (required)

                      Last Name (required)

                      Your Email (required)

                      Preferred Method of Contact (required)
                      eMailPhoneSkypeWhatsApp/Viber/Telegram,etc.

                      Your Phone (required)

                      Your Mobile

                      Your Skype

                      Category (required)

                      Subject (required)

                      Your Message (required)

                      I am interested in (tick all that apply):

                      GDPR Agreement*
                      See our privacy policy to learn more about how we use data.

                      Use this image to open your trading account with MultiBank MEXAtlantic