Asian stocks tracked a strong Wall Street rally on Thursday after US President Donald Trump cooled tariff threats against key European nations during the World Economic Forum (WEF) in Davos. The move eased fears of a global trade war and sparked renewed optimism across global markets.
Investors also cheered a powerful rebound in technology stocks, driven by fresh enthusiasm around artificial intelligence after Nvidia’s CEO said the sector would require trillions of dollars in investment.
Asian Markets Rise as Trade Tensions Ease
Markets across Asia climbed after Trump signalled a softer stance on tariffs linked to European opposition to the US interest in Greenland.
Earlier in the week, markets were rattled when Trump warned he could impose levies on countries including:
- Germany
- France
- Britain
- Denmark
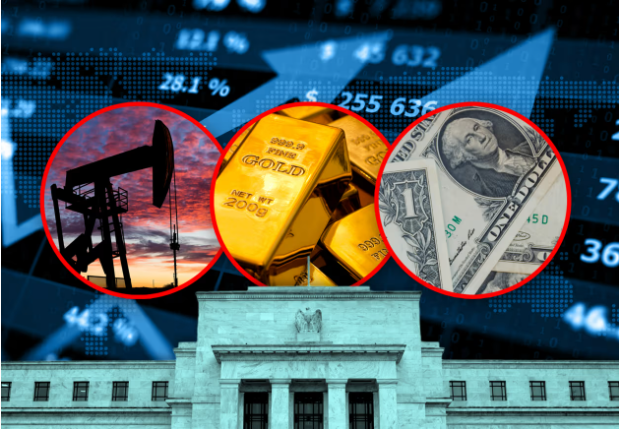
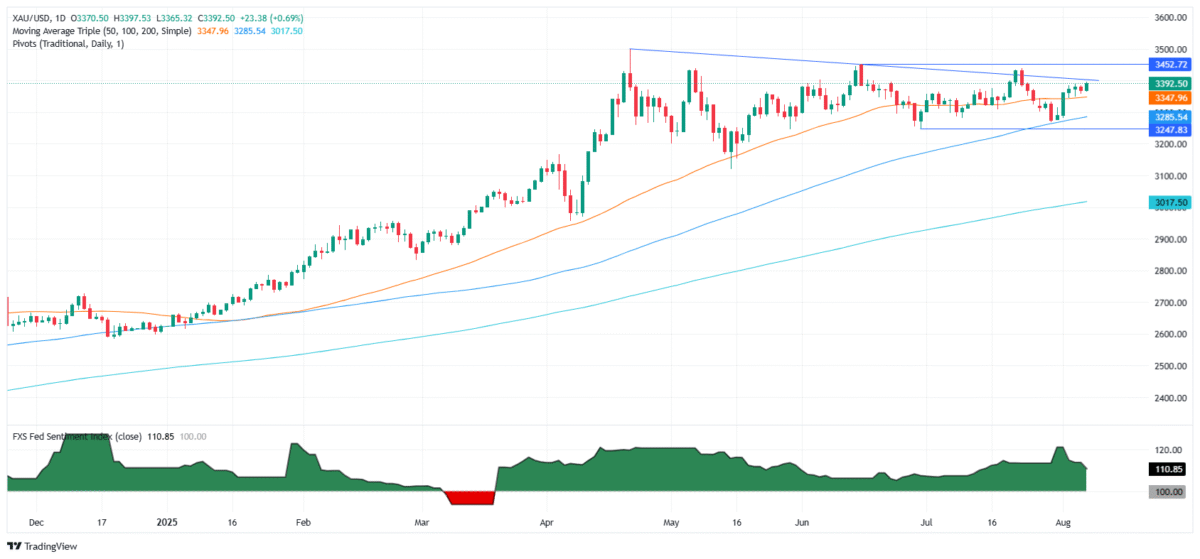
Those threats triggered warnings of retaliation from European leaders, fuelling volatility and driving investors toward safe-haven assets such as gold and silver.
However, sentiment shifted after Trump told delegates in Davos that he would not use force to take Greenland and later confirmed he had retracted the planned tariffs.
“Based upon this understanding, I will not be imposing the tariffs that were scheduled to go into effect on February 1st,” Trump said on Truth Social.
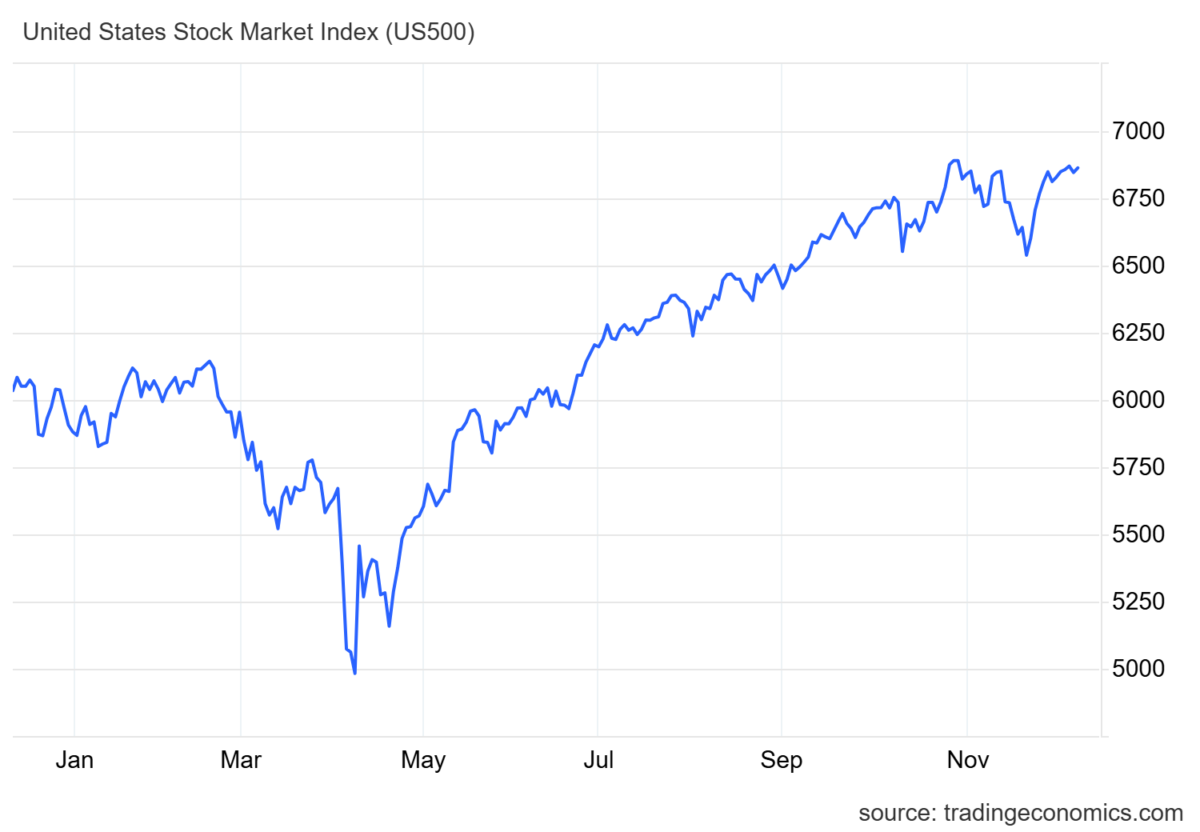
Wall Street Rally Lifts Asian Stocks
The announcement sparked a rally of more than 1% in US stocks, helping markets recover from sharp losses earlier in the week. Asian stocks followed Wall Street higher, with gains seen across the region:
- Tokyo
- Hong Kong
- Shanghai
- Sydney
- Seoul
- Singapore
- Taipei
- Manila
Analysts noted renewed confidence in what traders call the “Trump put”—the belief that sharp market declines pressure the US president to soften aggressive economic policies.
Tech Stocks Surge as AI Optimism Returns
Tech-heavy markets led the gains as enthusiasm for artificial intelligence surged back into focus.
At the World Economic Forum, Nvidia CEO Jensen Huang said the AI boom has triggered:
“The largest infrastructure buildout in human history.”
He added that while hundreds of billions of dollars have already been invested, trillions more will be required across:
- Energy infrastructure
- Cloud computing
- Semiconductor manufacturing
- Advanced electronics
Major Tech Movers
- Samsung Electronics: +3%
- SK hynix: +3%
- SoftBank: +7%
- Advantest & Tokyo Electron: +4%
- Disco Corp: +17% after strong earnings
- TSMC: +1%
South Korea’s benchmark index topped 5,000 points for the first time, driven by chipmaker gains.
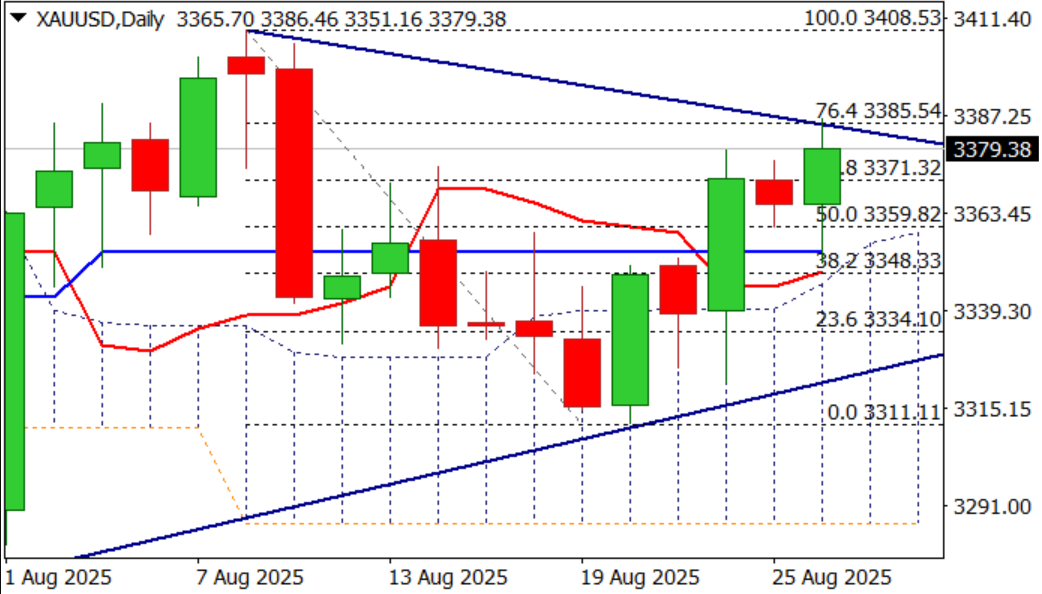
Safe-Haven Assets Retreat
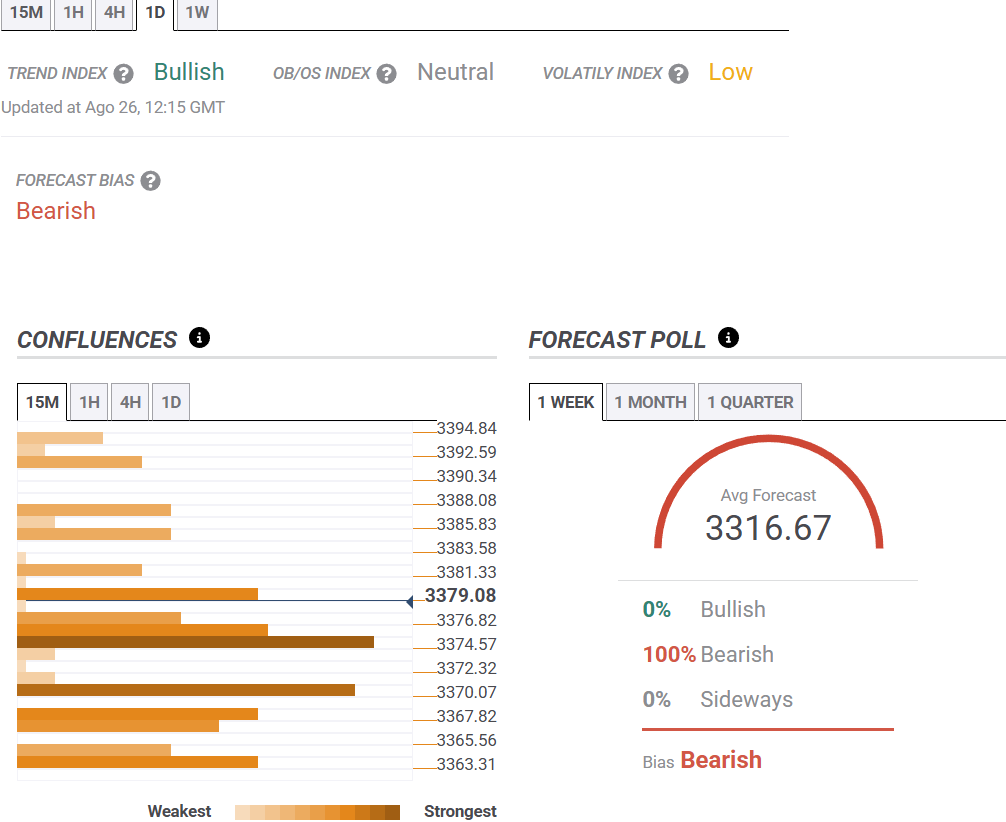
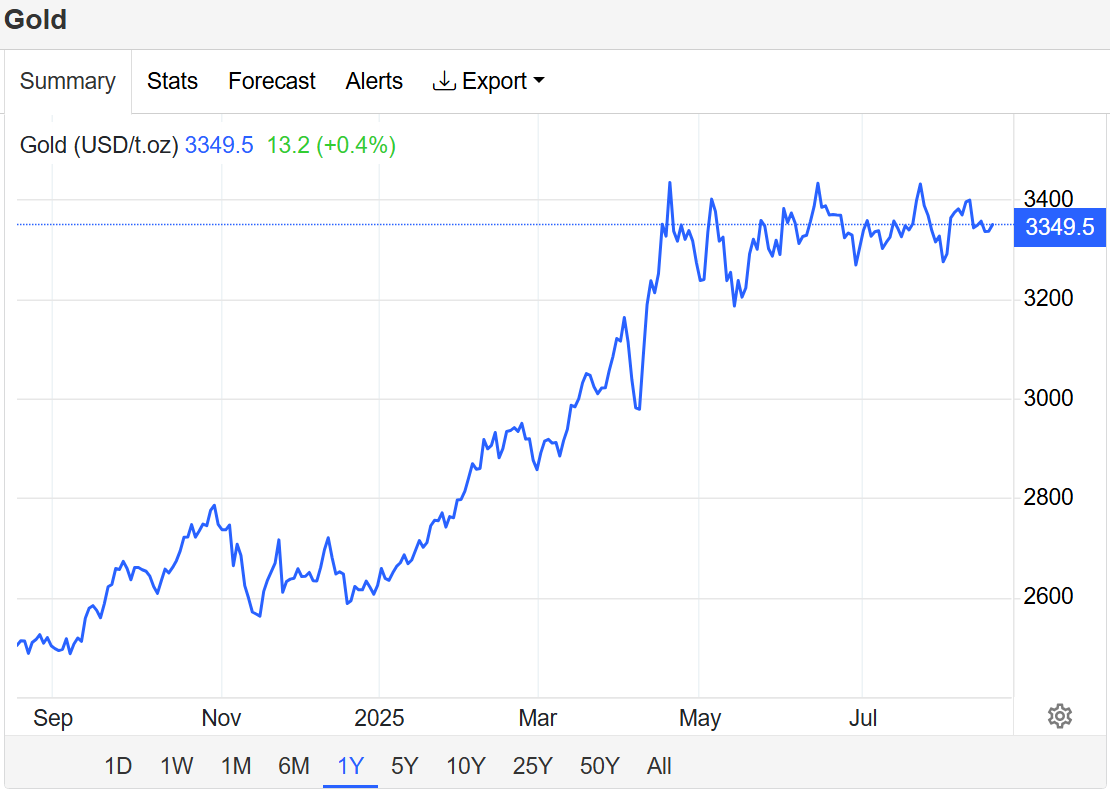
As risk appetite improved, gold and silver prices fell, extending losses from the previous session. Both metals had recently hit record highs as investors sought protection from escalating geopolitical risks.
According to SPI Asset Management’s Stephen Innes, markets reacted positively to Trump’s de-escalation:
“The market went from pricing a live grenade to pricing an option that expires sometime later.”
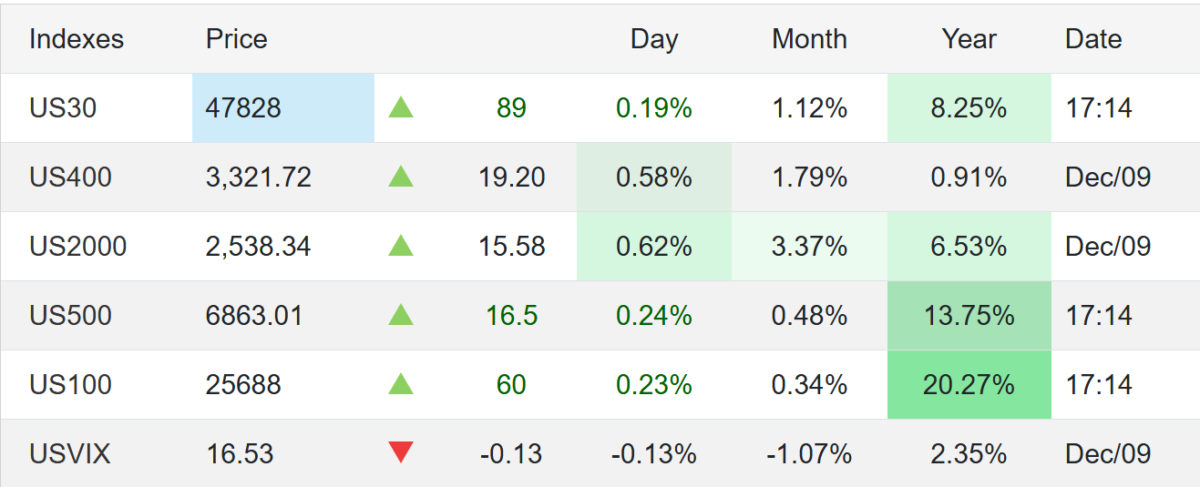
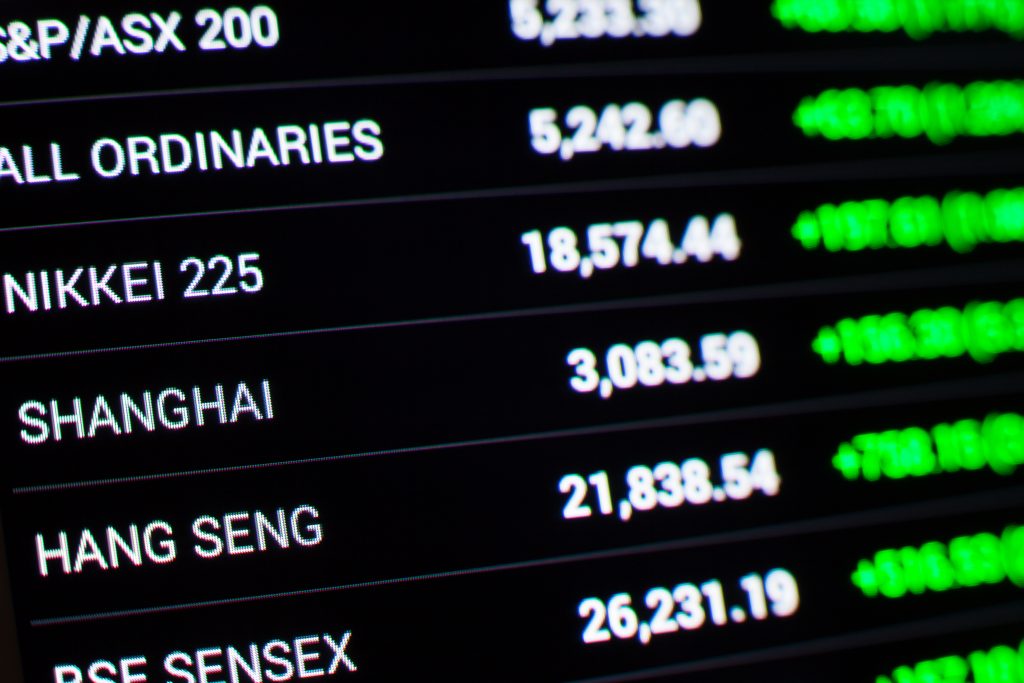
Key Market Snapshot
Asia (around 0230 GMT):
- Nikkei 225: +1.9%
- Hang Seng Index: +0.2%
- Shanghai Composite: +0.2%
US & Europe:
- Dow Jones: +1.2%
- FTSE 100: +0.1%
Commodities:
- WTI Crude: $60.69 (+0.1%)
- Brent Crude: $65.29 (+0.1%)
Conclusion: Markets Welcome a Calmer Tone
Asian stocks tracking the Wall Street rally highlight how quickly global markets respond to shifts in political tone. Trump’s retreat from tariff threats reduced immediate trade war fears, while renewed excitement around AI helped propel tech stocks higher.
With volatility still elevated, investors will remain focused on geopolitical signals, trade policy, and technology investment trends in the weeks ahead.
Use The Swap Hunter System

We highly recommend the MEX Atlantic part of the Multibank Group to house our clients at for many reasons check them out!