US equities were mostly flat as traders awaited the Federal Reserve’s interest-rate decision.
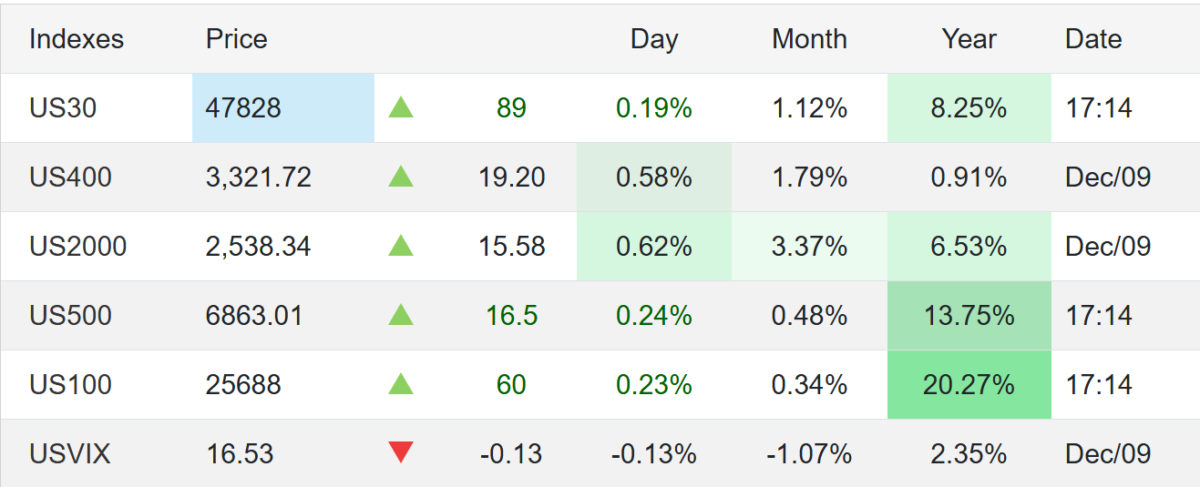
S&P 500: +0.1%
Dow Jones: +90 points
Nasdaq: Near unchanged
Expectations: Markets are widely pricing in a 25 bp rate cut on Wednesday. Focus is shifting to the Fed’s updated economic projections, especially regarding the pace of policy easing in 2026.
Labor Market
JOLTS (Sept & Oct): Job openings came in above expectations, signaling still-firm demand for labor.
ADP employment (weekly average through Nov 22):
Private employers added ~4,750 jobs per week, ending three straight periods of declines.
Silver (XAG/USD) is pulling back after touching recent highs above $39.00. Now trading below $38.50 as the US Dollar extends its rally. The decline comes as the US Dollar Index (DXY) posts gains for the fourth consecutive session.
Supported by a weak Euro amid political turmoil in France.
Although markets remain cautious about the Federal Reserve’s independence and rising expectations of rate cuts, the Greenback’s resilience is keeping precious metals under pressure.
Technical Analysis: $38.35 Support Key for Silver Bears
From a technical perspective, XAG/USD shows a bearish correction from last week’s one-month high at $39.07. Price action is testing support at $38.35 (August 25–26 lows).
A break below $38.35 could drag Silver toward the August 22 low at $37.70, with the next support at $37.25, the lower boundary of the ascending channel.
On the upside, immediate resistance lies near $38.75 and $38.85, followed by the August 22 high at $39.10 and July 22 high at $39.55.
Outlook for Traders
Silver traders should closely watch the $38.35 support zone. A downside break may accelerate bearish momentum, while a rebound above $38.75 could bring back buyers targeting $39.10 and beyond.
For now, Dollar strength remains the dominant driver, leaving Silver vulnerable to further declines.
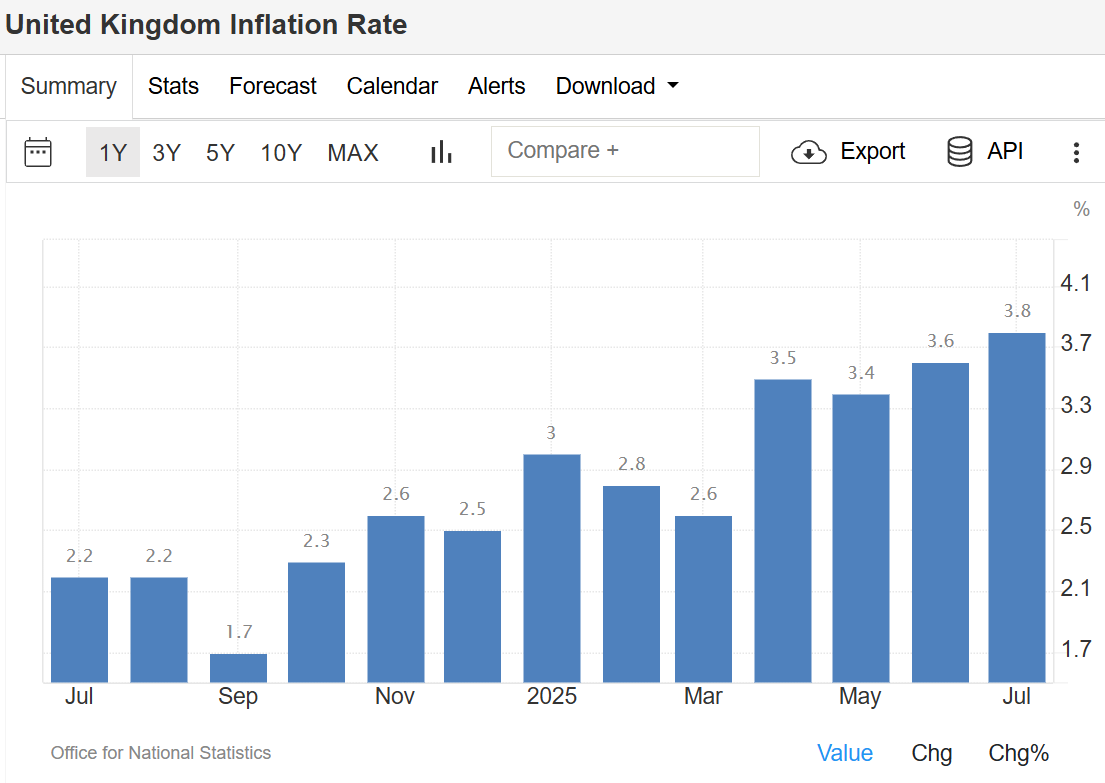
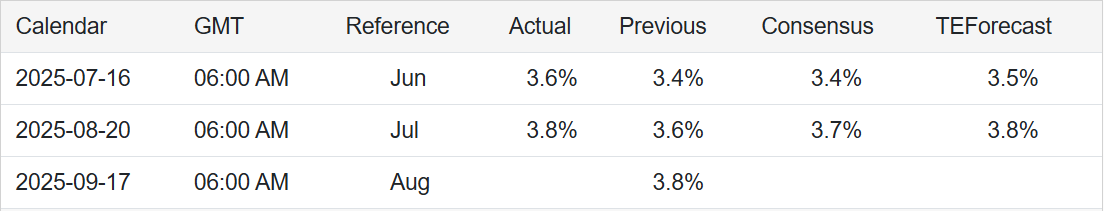
The UK inflation rate rose to 3.8% in July 2025, marking its highest level since January 2024. This was up from 3.6% in June and slightly above market forecasts of 3.7%, according to the Office for National Statistics (ONS).
The main driver of the increase came from the transport sector, where prices climbed 3.2% compared to 1.7% in June. Airfares surged by a sharp 30.2%, largely influenced by the timing of the school summer holidays. Higher motor fuel costs, sea fares, and roadside recovery services also pushed transport inflation higher.
Other notable contributors included restaurants and hotels, where prices rose 3.4% versus 2.6% in June, largely due to more expensive overnight hotel stays. Food and non-alcoholic beverages also accelerated, rising 4.9% compared to 4.5% the previous month.
On the other hand, housing and household services eased slightly, providing some relief. Inflation in this category dropped to 6.2% from 6.7%, reflecting softer growth in owner-occupiers’ housing costs and rents.
On a monthly basis, the Consumer Price Index (CPI) increased 0.1% in July, defying expectations of a 0.1% decline. However, this was slower than June’s 0.3% rise. Core inflation, which excludes energy, food, alcohol, and tobacco, also edged up to 3.8% from 3.7%. source: Office for National Statistics
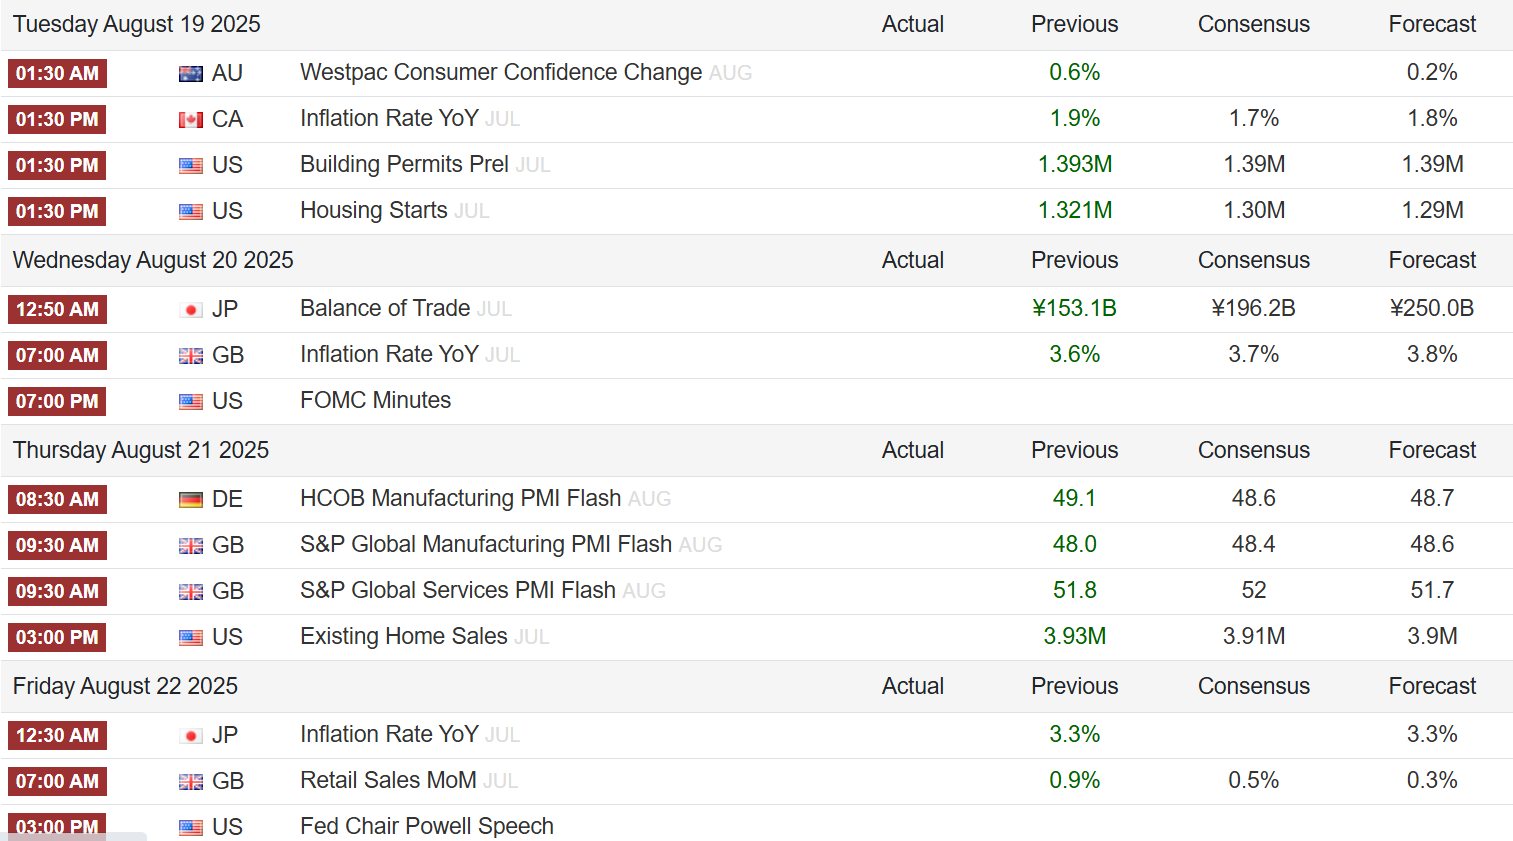
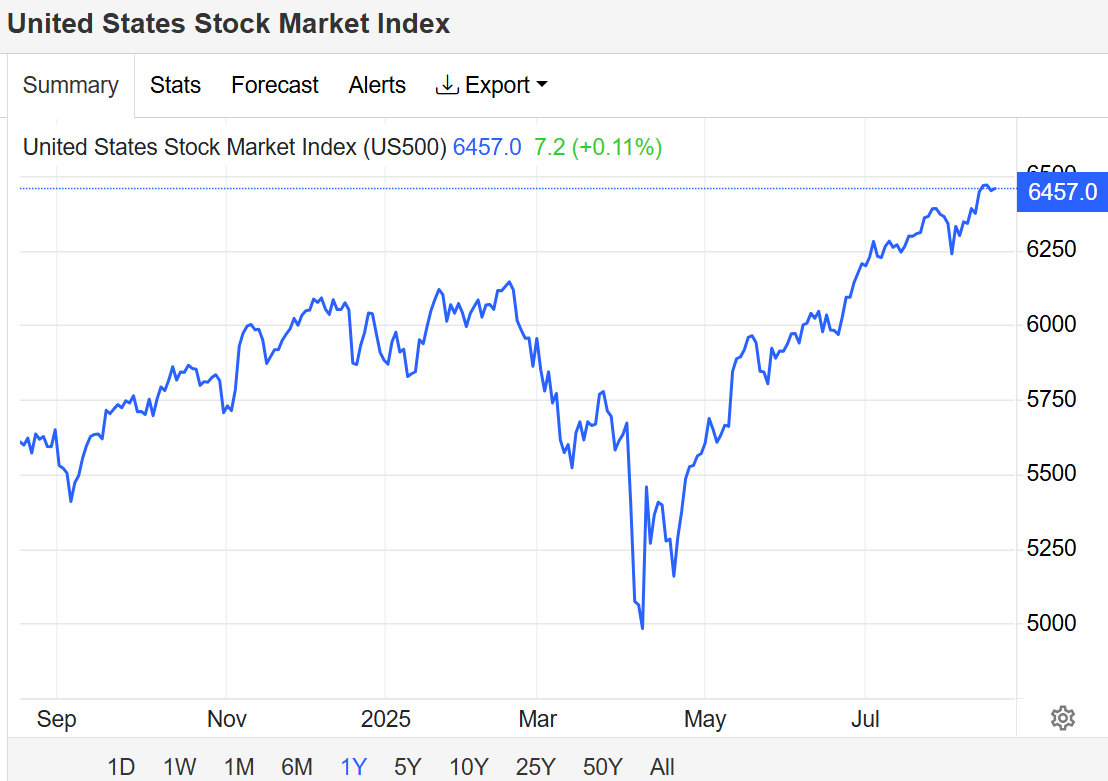
US stocks saw limited movements on Monday, with major indexes holding near their record highs from last week. The S&P 500, Nasdaq 100, and Dow Jones Industrial Average all traded flat as investors awaited fresh catalysts, particularly from:
The Federal Reserve’s FOMC meeting minutes
The Jackson Hole Symposium later this week
Both are expected to offer hints on the Fed’s interest rate outlook.
Trade these data points with Swap Hunter by your side and you are going to have an edge on your Broker, your Bank and your Colleagues.
Equities remain supported by growing bets on multiple rate cuts this year, as markets respond to signs of a softening labor market and disinflation pressures.
Key Market Highlights:
Chipmakers and AI-exposed stocks climbed, with Nvidia (+0.5%) staying near record highs despite recent US export controls.
Retail stocks were mixed ahead of upcoming quarterly earnings reports.
Geopolitical backdrop: EU leaders prepared to meet Ukraine’s President Zelensky following US President Trump’s summit with Russian President Putin.
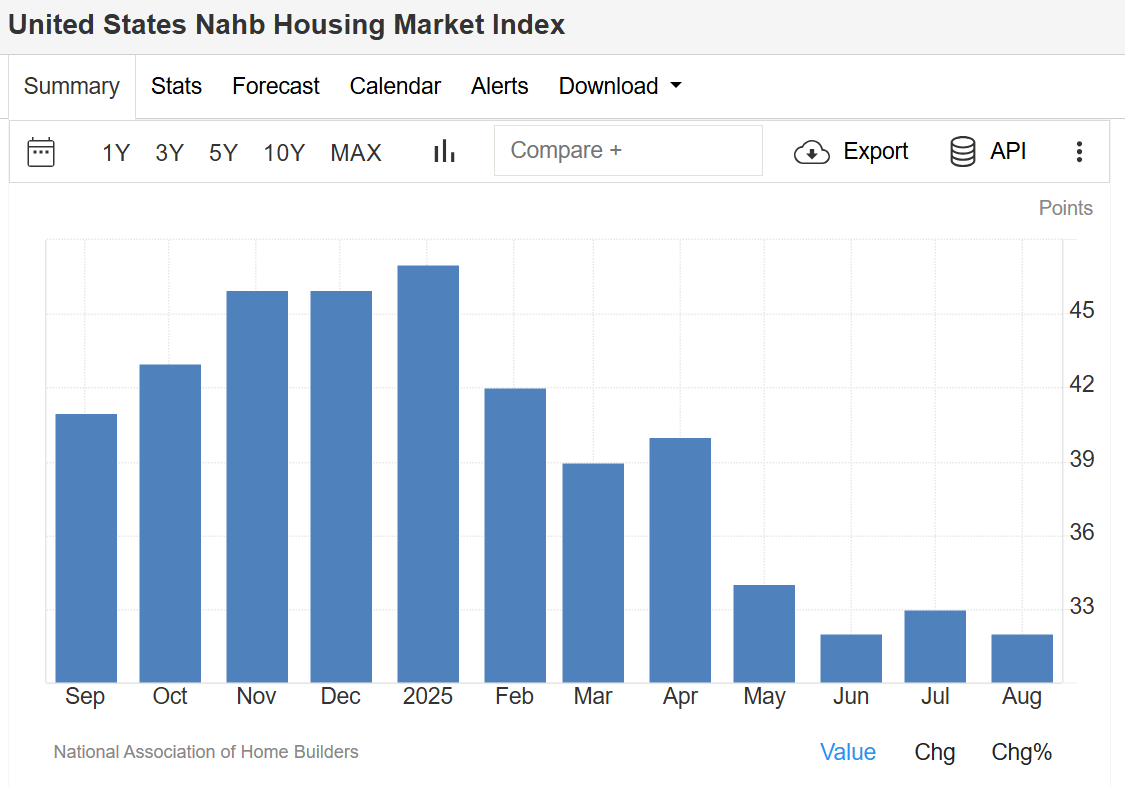
NAHB Housing Market Index – August 2025
The NAHB/Wells Fargo Housing Market Index (HMI) slipped to 32 in August 2025, down from 33 in July and below expectations of 34, signaling persistent challenges in the housing sector.
Breakdown of Housing Data:
Current sales conditions: fell one point to 35
Sales expectations (next 6 months): steady at 43
Buyer traffic: rose two points to 22, still at historically low levels
Builder Incentives & Pricing Trends:
37% of builders cut prices in August (down from 38% in July)
Average price reduction remained at 5% for the tenth straight month
66% of builders used sales incentives, the highest post-Covid level, up from 62% in July
This data reflects ongoing affordability concerns, limited buyer demand, and sustained reliance on incentives to stimulate sales. source: National Association of Home Builders
Stock Market: Investors remain cautious but optimistic, balancing AI-driven growth and monetary policy expectations.
Housing Market: Persistent weakness in builder confidence highlights the impact of affordability challenges, even as incentives expand.
📊 Both markets remain heavily influenced by Federal Reserve policy signals, making this week’s Jackson Hole Symposium a pivotal event for investors and analysts.
Frequently Asked Questions (FAQ)
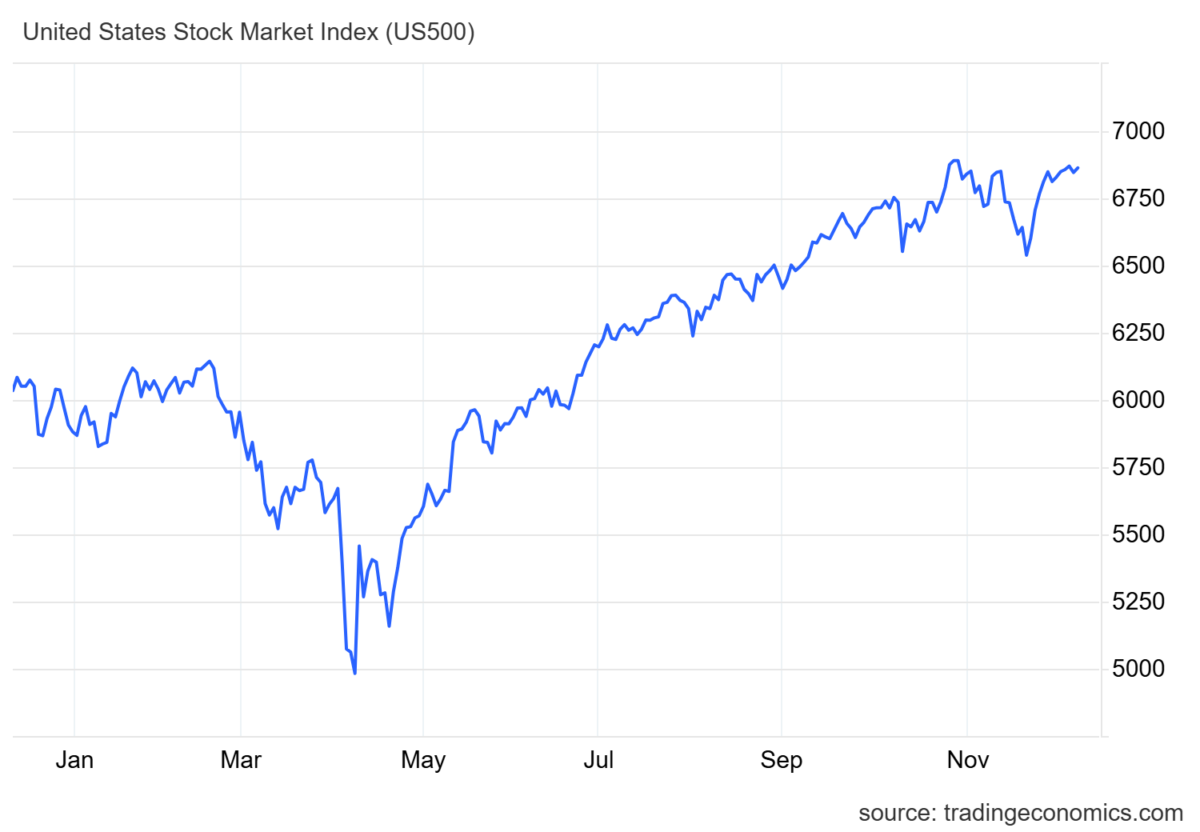
1. What is the current United States Stock Market Index level in August 2025?
In August 2025, the S&P 500, Nasdaq 100, and Dow Jones remain near record highs after a strong rally earlier in the month. Markets are currently trading flat as investors await signals from the Federal Reserve’s policy outlook.
2. Why are US stocks trading flat despite strong AI and chipmaker performance?
While AI-related stocks like Nvidia continue to perform strongly, overall market movement is subdued due to uncertainty over the Federal Reserve’s interest rate decisions. Investors are waiting for clarity from the Jackson Hole Symposium and FOMC meeting minutes.
3. What does the NAHB Housing Market Index measure?
The NAHB/Wells Fargo Housing Market Index (HMI) measures builder confidence in the housing market, covering current sales, buyer traffic, and future sales expectations. A reading above 50 indicates optimism, while below 50 reflects weakness.
4. Why did the NAHB Housing Market Index fall in August 2025?
The index fell to 32 in August 2025 due to weak buyer demand, affordability challenges, and higher reliance on sales incentives and price cuts by builders.
5. Are US home builders offering more incentives in 2025?
Yes. In August 2025, 66% of builders reported using sales incentives, the highest since the post-Covid period. Price cuts remain common, with an average reduction of 5% per home.
Technical Analysis: S&P 500 – August 2025
The S&P 500 continues to hover near record highs after its sharp rally this summer. Momentum remains strong, but the index is showing signs of consolidation as traders await policy signals from the Federal Reserve.
Key Technical Levels
Resistance Zone: 5,650 – 5,700 → The index is struggling to break above this level, marking a potential short-term ceiling.
Support Levels:
5,500 (near-term support) – A break below could invite short-term selling.
5,350 (major support) – A key level to watch, aligning with the 50-day moving average (50-DMA).
Moving Averages
50-Day Moving Average (50-DMA): ~5,350 – Currently acting as strong dynamic support.
200-Day Moving Average (200-DMA): ~4,950 – Well below current levels, confirming a longer-term bullish trend.
Momentum Indicators
RSI (Relative Strength Index): Hovering around 64, just below the overbought threshold (70). This suggests the index is consolidating but not yet in danger of a deep correction.
MACD (Moving Average Convergence Divergence): Still in positive territory, though momentum is flattening, pointing to a possible range-bound movement in the short term.
Chart Outlook
The S&P 500 remains bullish in the medium to long term, supported by AI-driven growth and easing inflation expectations. However, short-term consolidation is likely until traders get more clarity from Fed policy announcements.
Trading Strategy (Not Financial Advice):
Bullish bias above 5,500 support
Watch for a breakout above 5,700 for continuation toward new record highs
Caution: A sustained break below 5,350 could trigger deeper pullbacks
Australian Dollar Leads Gains, Asian Currencies Slip
The foreign exchange market saw notable movement today, with the Australian Dollar (AUD) emerging as the top gainer, while several Asian currencies faced pressure. Here’s a breakdown of the latest action:
🔼 Top Currency Gainers
🇦🇺 Australian Dollar (AUD) – +0.30%
The AUD surged on the back of robust trade data and stronger commodity prices, outpacing its peers in today’s session.
💵 Dollar Index (DXY) – +0.02%
The U.S. Dollar index posted a modest gain as traders remain cautious ahead of upcoming U.S. labor market reports later this week.
🔽 Top Currency Losers
🇰🇷 South Korean Won (KRW) – -0.26%
The KRW dropped the most among major currencies due to export concerns and regional geopolitical uncertainty.
🇯🇵 Japanese Yen (JPY) – -0.18%
The JPY weakened as the Bank of Japan stays committed to its ultra-loose monetary stance.
🇬🇧 British Pound (GBP) – -0.10%
The GBP slipped after soft inflation data led traders to price in a more dovish outlook from the Bank of England.
🇪🇺 Euro (EUR) – -0.03%
The Euro edged slightly lower amid mixed eurozone data and cautious signals from the European Central Bank (ECB).
📊 FX Performance Summary
Currency
Change (%)
Movement
🇦🇺 AUD
+0.30%
Strong Gain
💵 DXY
+0.02%
Mild Upside
🇪🇺 EUR
-0.03%
Slight Decline
🇬🇧 GBP
-0.10%
Weakening
🇯🇵 JPY
-0.18%
Under Pressure
🇰🇷 KRW
-0.26%
Sharp Decline
💬 Market Outlook
With commodity markets holding firm and economic data rolling in, traders will continue watching central bank policy cues and geopolitical developments. The AUD’s strength may persist if risk sentiment remains positive, while Asian currencies may stay under pressure without regional economic improvement.
📝 Stay Updated
Join our Telegram Channel or on WhatsApp for real-time market insights, chart analysis, and strategy tips.
You can also register your details in this form to stay updated with our Trading Activities and strategies.
Open an Account with our Recommended Broker and get ongoing training and support using Swap Hunter, Market analysis, Strategy assistance and coaching or a fully Managed Account through Copy Trading or PAMM Solutions. Just click on image below and register your Trading account today.
Click on Image to Register with Top Broker in the Industry
📈 US Stocks Surge as Fed Cut Hopes and Trade Truce Drive Gains
Published: June 30, 2025 Category: Markets & Economy
US equities rallied on Monday, extending last week’s gains as easing trade tensions and growing expectations of interest rate cuts by the Federal Reserve pushed major indexes to record highs.
🔼 Major Indexes Reach New Highs
S&P 500 and Nasdaq 100: Up 0.5% each
Dow Jones Industrial Average: Gained over 200 points
📰 Market Drivers
1. 🇺🇸 US-China Trade Agreement
The US and China announced a formal agreement to prevent new tariffs, with President Trump showing flexibility on the July 9 deadline for reintroducing reciprocal tariffs. This marks a major de-escalation from past tensions, when tariffs reached up to 145%.
2. 🏦 Fed Rate Cut Expectations Rise
Investor confidence is rising as soft inflation data and global uncertainties increase the likelihood of multiple Fed rate cuts in 2025.
3. 💻 Tech Sector Strengthens
Canada scrapped its digital services tax, boosting US tech stocks and reopening trade talks.
Meta and Alphabet shares rose 1%.
Juniper Networks soared 9% after the DoJ approved its HP acquisition, settling a legal dispute.
💶 Eurozone: Euro Hits $1.17 as German Inflation Falls
The euro rose to its highest level since September 2021, trading just above $1.17, bolstered by:
Weaker US dollar from dovish Fed sentiment
Fiscal concerns in the US
Cooling inflation in Germany
🇩🇪 Germany Inflation Back to Target
According to the Federal Statistical Office:
CPI fell to 2.0% in June, down from 2.1%, beating forecasts
Core inflation eased to 2.7%, a 3-month low
Food inflation slowed to 2.0%, energy prices dropped -3.5%
Monthly CPI was flat, following a 0.1% rise in May
🏦 ECB Policy Outlook
While inflation edged up slightly in France, Italy, and Spain, the ECB maintains a cautious approach. Vice President Luis de Guindos reaffirmed that the current policy is appropriate, but warned of the need for flexibility amid economic uncertainty.
Markets continue to price the ECB’s terminal rate around 1.75%–1.80%.
📊 Key Takeaways
✅ US markets are responding positively to reduced geopolitical risk and a potential easing cycle from the Fed.
✅ Eurozone inflation data provides mixed signals but supports a stable ECB outlook.
✅ Tech stocks may continue to benefit from regulatory relief and favorable trade shifts.
When is the right time to start selling the Stock Market at all time highs?
S&P 500 Past 10 Years
Stock Market at All Time highs. We are witnessing the longest BULL rally in 100 years. Many economists say this is due to loose monetary policy. Quantitative Easing and now the introduction of Interest Rate Cuts being used to stimulate growth are a major cause of the stock market at to be at all time highs. Also an incredibly strong labor market in the United States is also a cause of this historic rally. With the U.S. at full employment.
US-China Trade Deal Phase one has been reached and this is another market positive. Some say it is just a political move in preparation for the US 2020 Presidential election. It will take some pressure off US farmers and middle Americans who are a large chunk of Trump’s political base. But world famous economist Mohamed El-Erian is slightly more pessimistic than the White House would have us believe. As you can read in this CNBC article.
It is difficult to use technical analysis in order to choose an entry point to sell the markets. As there is so much geopolitical and fundamental news to digest and analyse. The news headlines are coming in thick and fast. And sentiment is changing all the time.
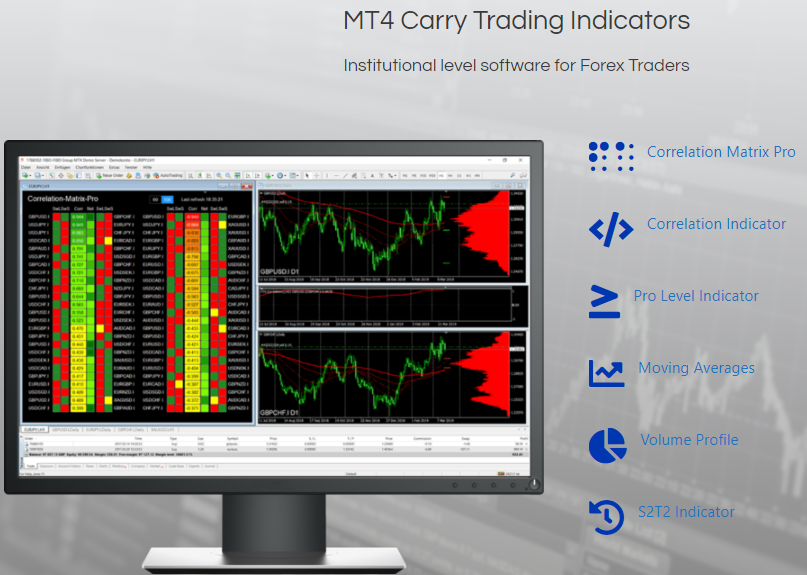
How can Swap Hunter help you with this unpredictable scenario?
Carry Trading is the solution, but the way our software does it is unique. We do not just trade in one direction when using the Swap Hunter software. We hedge correlated assets and play the interest rates differentials of currencies in order to gain Swaps every day. We are hedging so we can lower the overall risk of the market. Our goal is to provide our clients with full support and education in order for them to generate more interest than the Banks.