Key Points
• A market valuation metric popularized by Warren Buffett is at an all-time high of roughly 208%.
• Buffett has said that anytime this indicator approaches 200%, investors are “playing with fire.”
• History has proven Buffett right in the past.
Even after Warren Buffett steps down as CEO of Berkshire Hathaway (NYSE: BRK.A) (NYSE: BRK.B), his legacy will live on. So will an indicator that bears his name.
Buffett told Fortune magazine in 2001 that this metric, now known as the Buffett indicator, is “probably the best single measure of where valuations stand at any given moment.” And now the Buffett indicator is at the highest level ever, sending a warning.
What is the Buffett indicator?
The Buffett Indicator measures the ratio of the total U.S. stock market capitalization to U.S. Gross Domestic Product (GDP).
- Low Readings (70–80%) → Historically great buying opportunities.
- High Readings (200%+) → Elevated risk of overvaluation.
Originally, Buffett used Gross National Product (GNP), but GDP is now more commonly applied in the calculation.
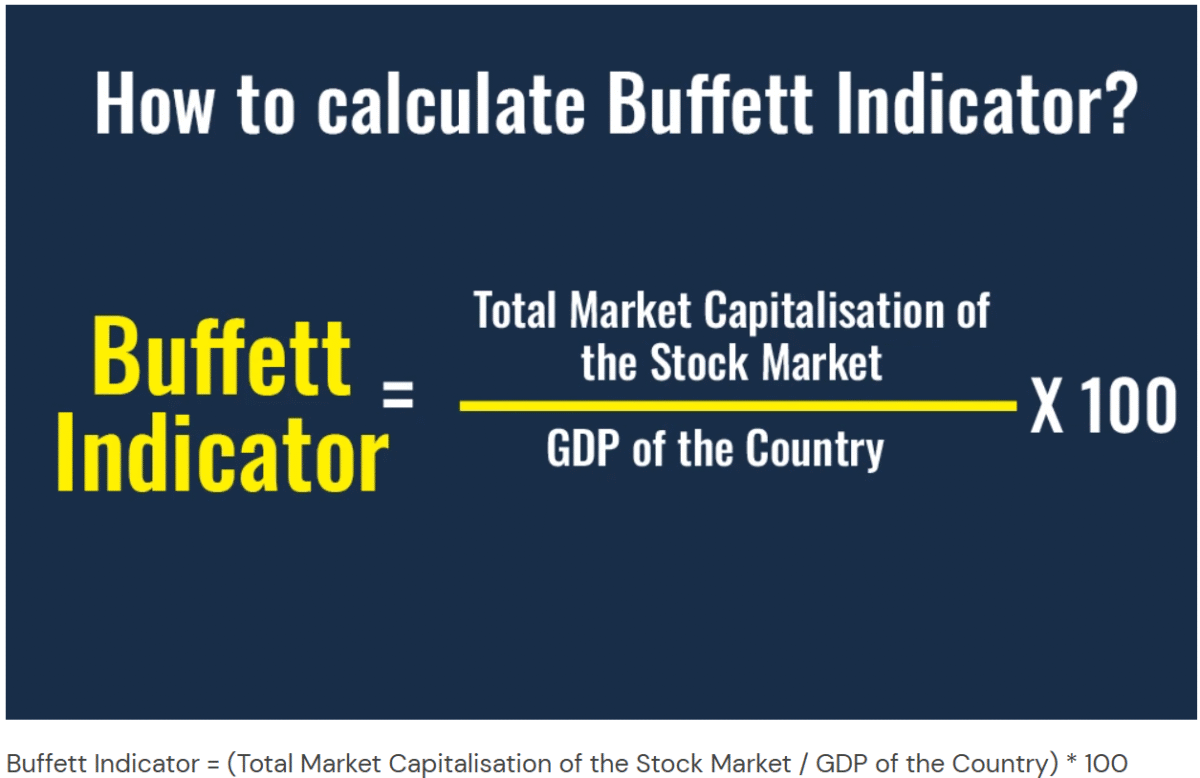
The Buffett Indicator, also known as the Market Cap to GDP Ratio, is a valuation metric used to assess whether the stock market is overvalued or undervalued relative to the economy. It is calculated by dividing the total market capitalization of a country’s stock market by its gross domestic product (GDP).
Here’s the formula:
Buffett Indicator (%) = (Total Stock Market Capitalization ÷ Gross Domestic Product (GDP)) × 100
In a sense, the Buffett indicator is similar to the most widely used stock valuation metric — the price-to-earnings ratio. Instead of the share price of a single stock, the total market cap of all U.S. stocks is used. Instead of the earnings generated by a single company, the metric uses the total value generated by everyone in the U.S.
With the Buffett indicator and the price-to-earnings ratio, a lower number reflects a more attractive valuation. Buffett hinted at an ideal range for his namesake metric in the 2001 Fortune article, saying, “If the percentage relationship falls to the 70% or 80% area, buying stocks is likely to work very well for you.”
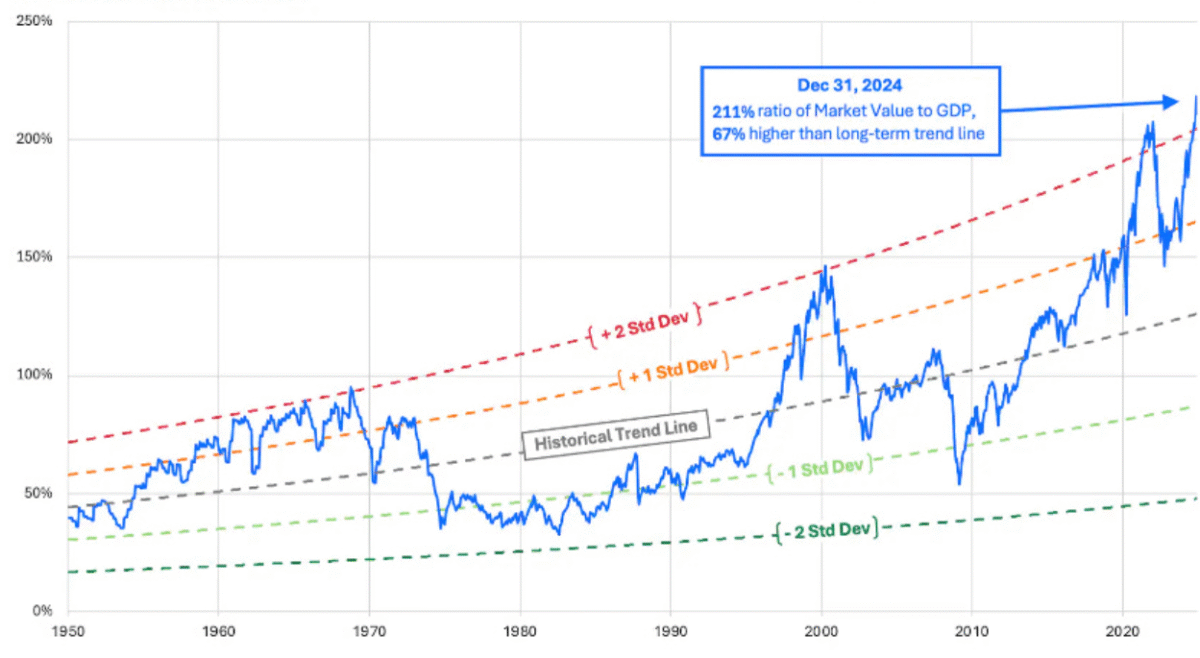
Here are various images of the Buffet Indicator demonstrating it’s accuracy to predict price action.
History lesson
As you might have guessed, the Buffett indicator isn’t anywhere close to the 70% to 80% range right now. It’s slightly over 208%, the highest level the indicator has ever reached!
If you want to know why Buffett isn’t buying many stocks these days, the Buffett indicator probably explains it.
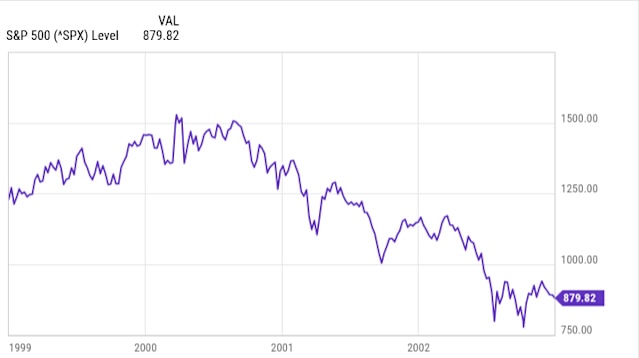
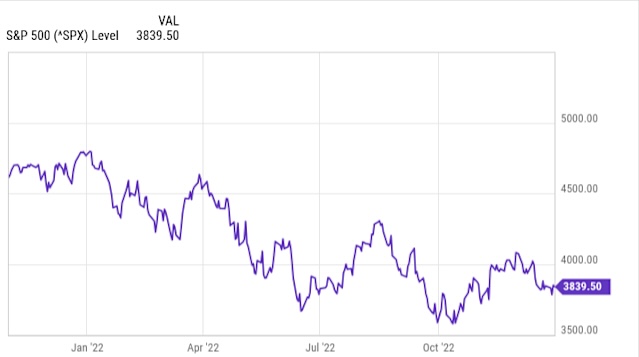
Buffett’s concern about a high market valuation as measured by the Buffett indicator has been justified by history. He mentioned the indicator spiking in 1999 and 2000, reaching what was then an all-time high. Many investors remember what happened soon afterward. The dot-com bubble burst, with the S&P 500(SNPINDEX: ^GSPC) plunging nearly 50% below its previous peak by late 2002.
The Buffett indicator again came close to hitting 200% in November 2021. Within a matter of weeks, the S&P 500 began to sink and eventually fell as much as 25%.
Will the stock market crash again soon?
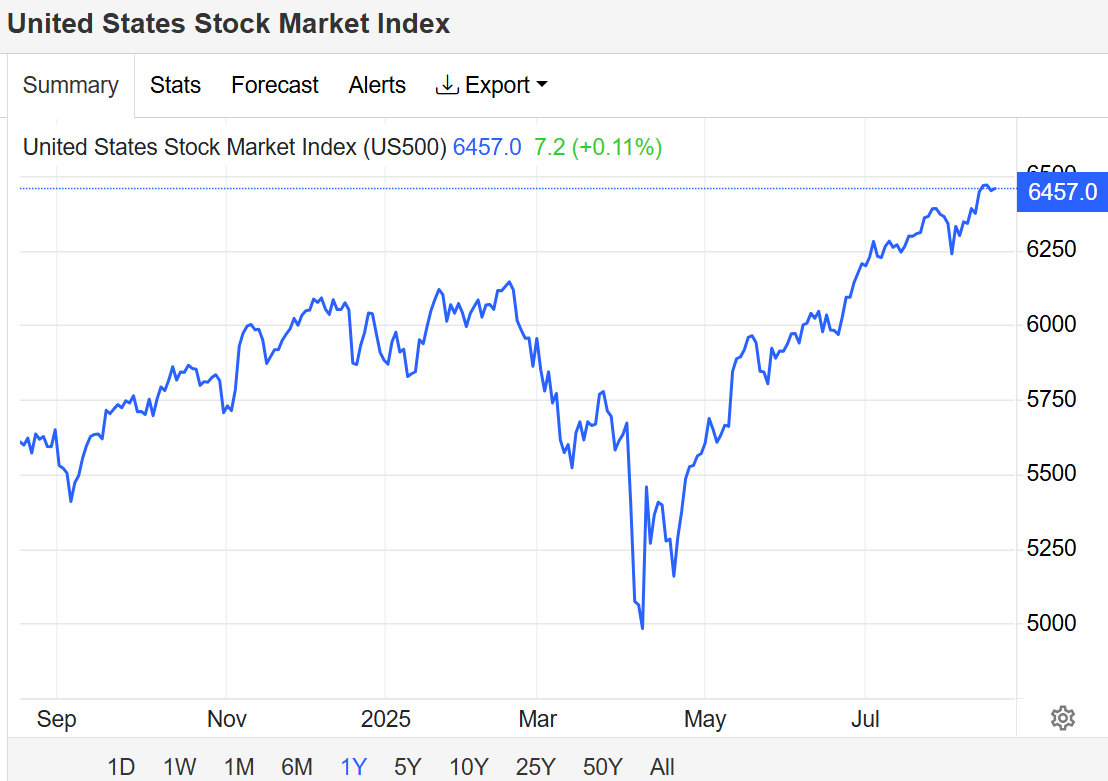
These historical precedents aren’t encouraging for investors. However, the Buffett indicator isn’t great at predicting short-term stock market moves. For example, the indicator has been above its level in early 2000 (right before the dot-com bubble burst) for most of the period since 2018. During this time, the S&P 500 has soared more than 130%, albeit with significant volatility.
However, there’s no getting around the fact that U.S. stocks are historically expensive.
The Buffett indicator isn’t the only metric that reflects this.
The S&P 500 Shiller CAPE ratio, popularized by Yale economics professor Robert Shiller, is near its third-highest level ever.
Stock valuations don’t tend to remain above historic levels for too long. Sooner or later, they will return to a more normal range. With the Buffett indicator at an all-time high, investors probably should brace themselves for what the stock market might do over the near term and almost certainly will do eventually – revert to the mean average, meaning huge declines across all global stock market Indices.
What Should Investors Do Now?
Stay disciplined – focus on long-term investment strategies rather than short-term market timing.
Don’t panic, but be cautious – high valuations increase risk. So it is time to start hedging, find correlated assets and create multiple hedges to balance your portfolio to preserve equity, minimize risk exposure, generate swaps, and create potential to make money on the downside and eventually the upside once the correction is over and markets start recovering.
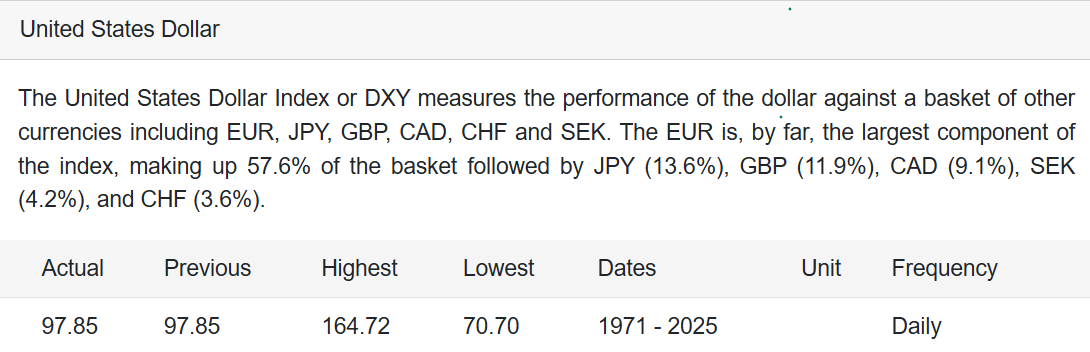
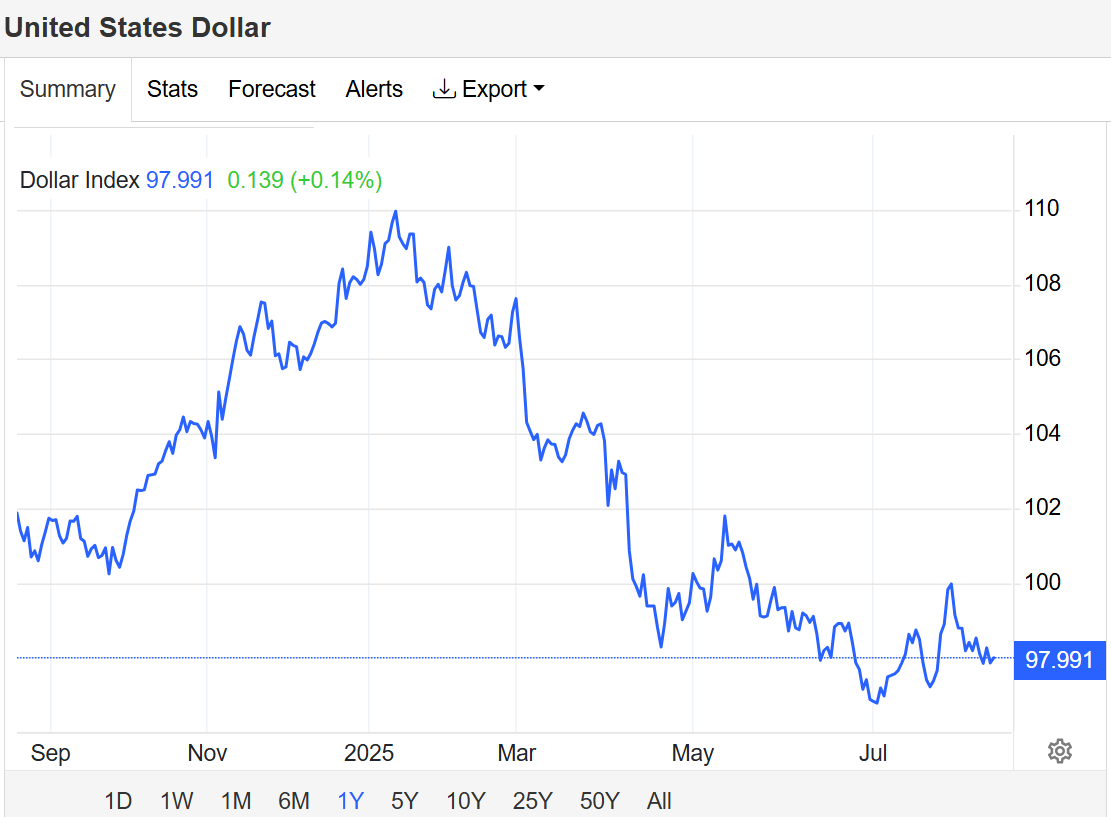
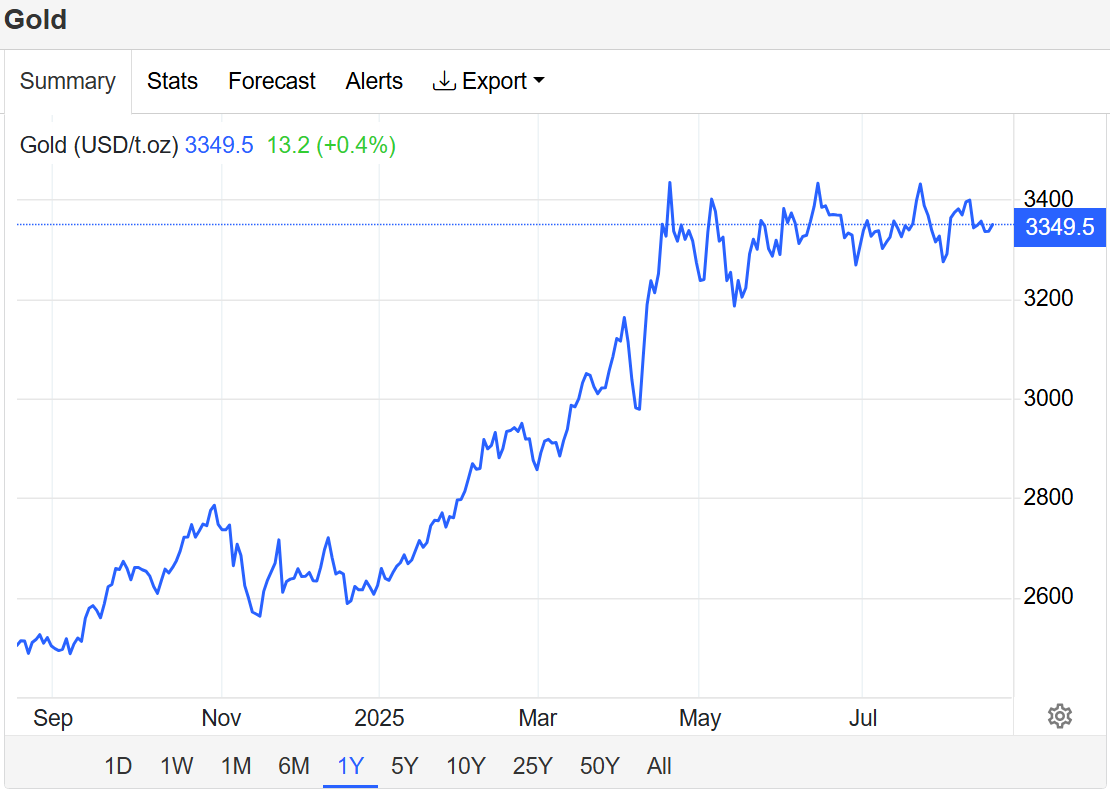
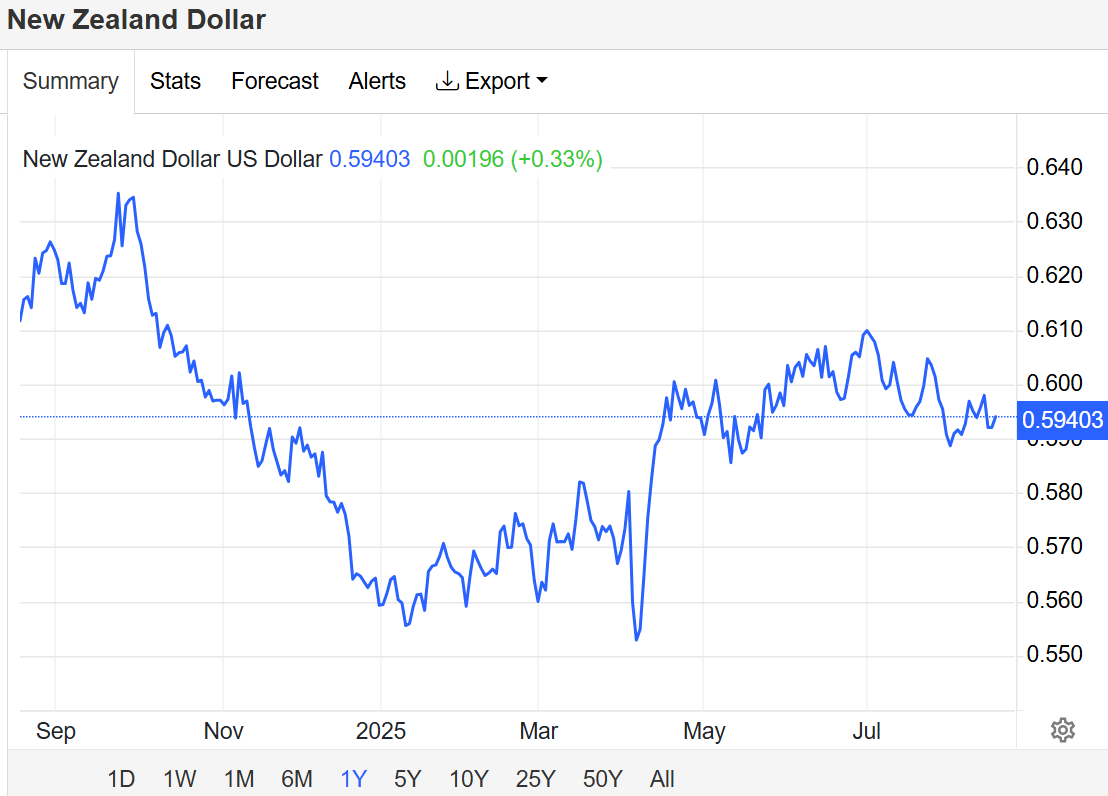
Diversify your portfolio – to manage volatility. Many stock pickers/investors are moving into Forex, Cryptocurrency ETF’s, Commodities and other Asset Classes.
Cryptocurrencies– Bitcoin, Ethereum, Ripple and Litecoin have had a lot of coverage recently for multiple reasons. Spot Crypto ETF’s and Stable Coins like USDC are gaining a lot traction and attracting many institutional level investors and the Banks with new legislation being passed post the latest U.S. election. We are happy to go into more detail with you in a private consultation.
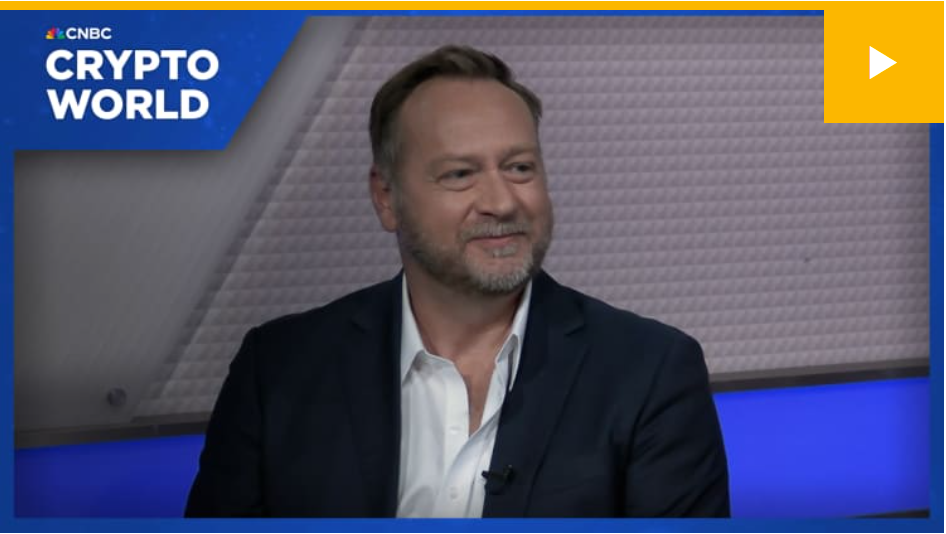
Canary Capital CEO Steven McClurg sits down with CNBC Crypto World to discuss spot crypto ETFs and regulatory advancements for digital assets in the United States.
Other Asset Classes to consider – Renewable Energies, Water, Data Mining, Rare Earth Metals, AI individual stocks and ETF’s are all places you want some exposure.
Indices – we have started taking short positions on the DOW, NASDAQ, S&P500, DAX30 and NIKKEI. Most of these are also offering a positive swap right now.
What Strategy Should investors use?
Strategy is everything. Our Carry Trade strategies at Swap Hunter offer risk minimization, equity preservation and slow and steady wealth generation. we always hear feedback from our clients how our system is low stress and requires little need for them to be glued to their screens all day and night using technical analysis, watching for data releases and news headlines that cause big movements on the markets and will affect their trades.
In trading, a carry trade means earning the difference between the interest rates of two currencies (the swap).
A carry trading indicator like Swap Hunter would help traders spot profitable carry opportunities — ideally before the market prices them in — by tracking interest rate differentials, central bank moves, volatility, and funding costs.
Find the Carry Trades Everyone Else Misses.
Most traders think they know their swap rates — until they wake up and find overnight funding costs quietly drained their profit.
The real edge in carry trading isn’t what your broker publishes — it’s the hidden shifts in funding costs, central bank signals, and liquidity squeezes that flip your positive carry negative before the market prices it in.
That’s the Black Swan that catches everyone — except the ones hunting it.
Before you buy stock in S&P 500 Index, consider:
Swap Hunter just identified what they believe are the best assets and trades for investors to buy now. The 10 trades that made the cut could produce monster returns in the coming years.
Create a stable, well balanced and diversified portfolio with our Swap Hunter software and Strategies
Register with Swap Hunter to receive all Benefits mentioned on our Site